Safe Births. Healthy Mothers and Babies.
Cesarean (C-section) deliveries can be life-saving procedures when medically necessary, but they carry a higher risk of negative outcomes for mothers and babies. Complication rates for women also increase with each C-section delivery. Current trends in maternity care show that many pregnant women undergo procedures such as C-sections, repeat C-sections, and labor inductions that may not be medically necessary.1
The C-section rate among low-risk, first-time mothers (also called Nulliparous, Term, Singleton, Vertex (NTSV) Cesarean Birth Rate), is the proportion of live babies born at or beyond 37.0 weeks gestation to women in their first pregnancy, that are singleton (no twins or beyond) and in the vertex presentation (no breech or transverse positions), via C-section birth. Narrowing variation and lowering the average C-section rate will lead to better quality care, improved health outcomes, and reduced costs.2
Indicator Progress
In 2012 (baseline year), the NTSV Cesarean Birth Rate was 27.0%. The most recent rate available is 23.4% (2018). We hope to reach a target of 23.9% or lower by 2022.
Baseline
27.0%
Target
23.9%
Indicator Highlights

Smart Care California Award
Smart Care California recognized 111 California hospitals with an award for meeting or surpassing the national Healthy People 2020 goal for low-risk, first-birth Cesarian sections (C-sections). While potentially life-saving in certain circumstances, C-sections can pose serious health risks for both babies and mothers. Unnecessary C-sections also burden patients — and the health care system as a whole — with unneeded costs. To receive this award, a California hospital achieved a C-section rate of 23.9 percent or lower for low-risk, first-birth deliveries. Read more »
Over the last 15 years, the C-section rate has increased from 21% to 33% with no observed improvements in maternal or newborn health outcomes.2
Today, the average vaginal delivery (facility costs and professional fees) in California costs $11,500 for commercial payers and $4,590 for Medi-Cal (California’s Medicaid Program), whereas the average C-section delivery costs $18,800 for commercial payers and $7,451 for Medi-Cal.5
C-sections in the NTSV population account for 60% of increase in the overall primary C-section rate in the last ten years, and represent 90% of the variation in hospital performance.6
When women have a C-section in the first labor, an estimated 90% of all later births will be by C-section. When women have a vaginal birth in the first labor, an estimated 90% of all later births will be vaginal.7
Data Snapshot: Trends & Disparities
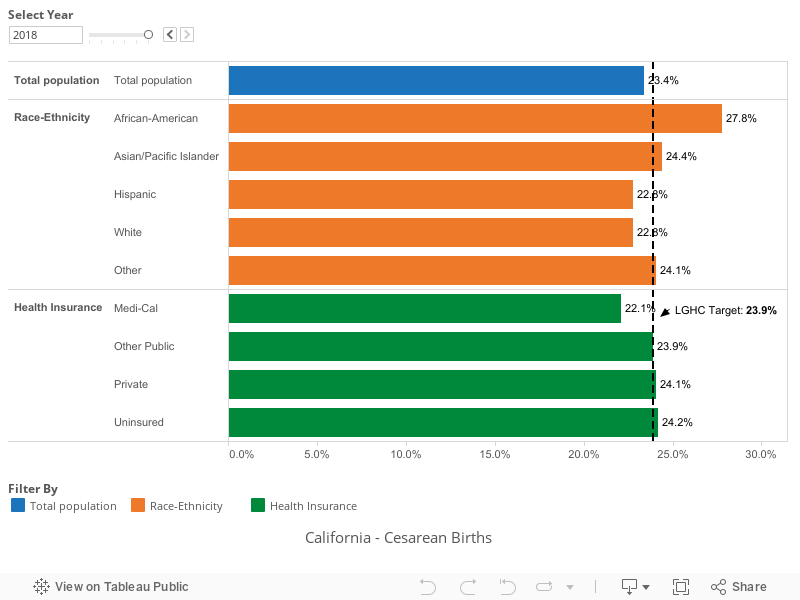
There are noticeable disparities in deliveries. With respect to Medi-Cal patients: non-Hispanic Black women have disproportionately higher C-section rates and higher rates of birth complications, including maternal death; while native born Hispanics have significantly lower rates of VBAC than other groups.5
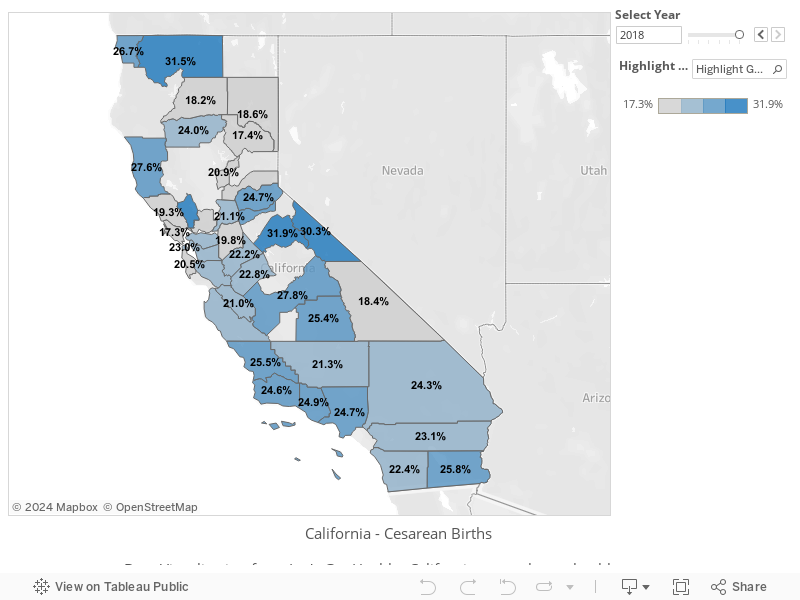
What is particularly noteworthy is the variation among California hospitals with total C-section rates ranging from 11.1% to over 76.9% in 2015.8
42% of California hospitals met the 23.9% target in 2015, a slight improvement from 2014 when 40% met the target.8
First-birth Cesarean Birth Rate, Over Time
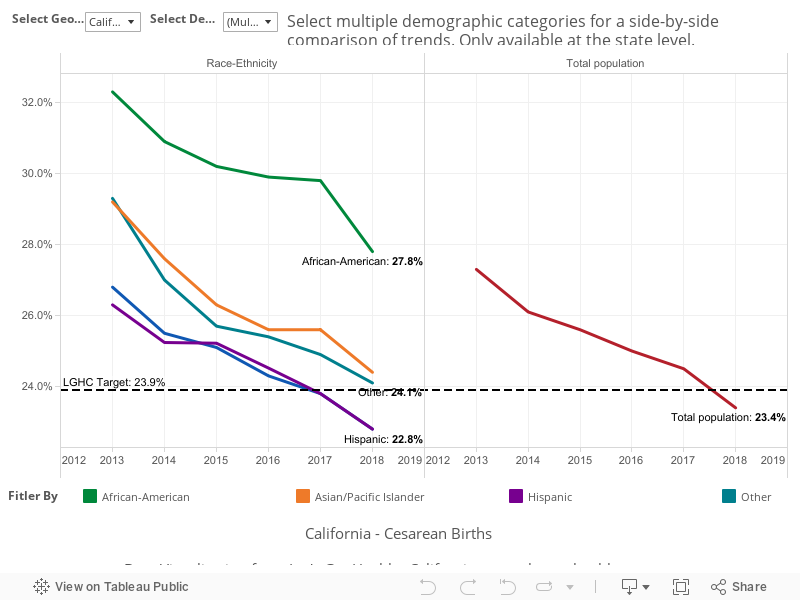
First-birth Cesarean Birth Rate, by Demographic Category
First-birth Cesarean Birth Rate, by County
|
Stories & Solutions
Increasing Breastfeeding Duration
If 90% of US families could comply with current medical guidelines to breastfeed exclusively for 6 months, the US could avoid about $18.5 billion per year in increased health care costs (2014 dollars). 1 [...]
Smart Care California Award
Smart Care California recognized 104 California hospitals with an award for achieving the national Healthy People 2020 goal for low-risk, first-birth Cesarian sections (C-sections).
Healthy Babies are Worth the Wait Community Program
Healthy Babies are Worth the Wait is a community program that focuses on decreasing “preventable” preterm birth through educating pregnant patients, perinatal providers, and the community on risk factors and strategies for reducing risks of preterm birth.
Share Your Story
Want to engage in moving the dial on Healthy Beginnings? Share your impact story!


