Reducing child maltreatment is a public health goal1
Neglect, physical, sexual, and emotional abuse, and intentional violation of custody agreements are types of child maltreatment. Experiencing child maltreatment can lead to poor physical and mental health throughout life.1 During childhood, children who experienced maltreatment are more likely to exhibit anxious, depressed, withdrawn, and aggressive behaviors,2 and poor emotional, social, and school functioning.3 As they reach adolescence and adulthood, individuals who experienced maltreatment during childhood are more likely to report having poor mental health, problematic substance use behaviors,4 and chronic conditions such as asthma, diabetes, and chronic pain.5
An allegation of child maltreatment is a suspected case of child abuse that is reported to Child Protective Services (CPS). A substantiated allegation is an investigated case of suspected child abuse where investigators decided that maltreatment took place.
This indicator tracks the number of substantiated allegations of child maltreatment per 1,000 children.
Child Maltreatment
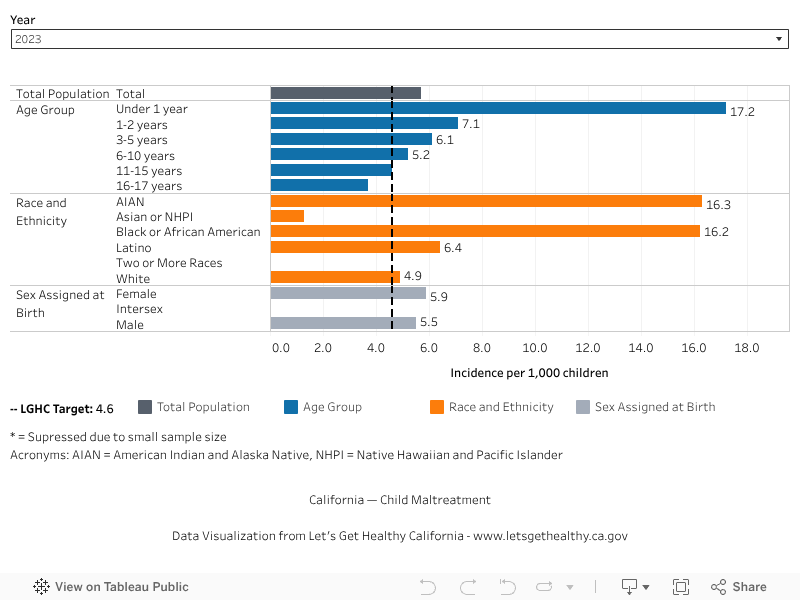
In 2023 (baseline year), there were 5.7 substantiated allegations of child maltreatment per 1,000 children. The most recent rate available is 5.7 (2023). We hope to reach a target of 4.6 or lower by 2034.
Baseline
5.7
Target
4.6
Data Snapshot
Substantiated allegations of child maltreatment are highest among Black or African American and American Indian and Alaska Native children, and lowest among Asian and Pacific Islander children in California.
Structural and systemic racism, discrimination, and implicit and explicit biases may increase the likelihood that Black or African American and American Indian and Alaska Native children are reported.6
These structural and systemic factors may also contribute to family and community-level risk factors, thus further affecting the risk for child maltreatment.6
Between 2012 and 2023, the incidence of substantiated allegations of child maltreatment in California has steadily and substantially decreased for all children as well as for each racial/ethnic group; however, disparities persist.
Substantiated Allegations of Child Maltreatment per 1,000 Children, Over Time

Substantiated Allegations of Child Maltreatment per 1,000 Children, by Demographic Category
|
Share Your Story
Want to engage in moving the dial on Healthy Beginnings? Share your impact story!


