National health spending growth is expected to accelerate 5.7 percent for 20171

The overall cost of health care includes more than just out-of-pocket costs and insurance premiums. Tracking California's compound annual growth rate (CAGR) of health care spending is one way to monitor the overall cost of care. This indicator is valuable as it includes past trends in rate of spending on health care, and also helps predict what the rate of spending is going to look like in the near future.

The Let's Get Healthy California goal is to bring California's growth rate of health care expenditures in line with the rate of growth in Gross State Product (GSP) by 2022.

Indicator Progress

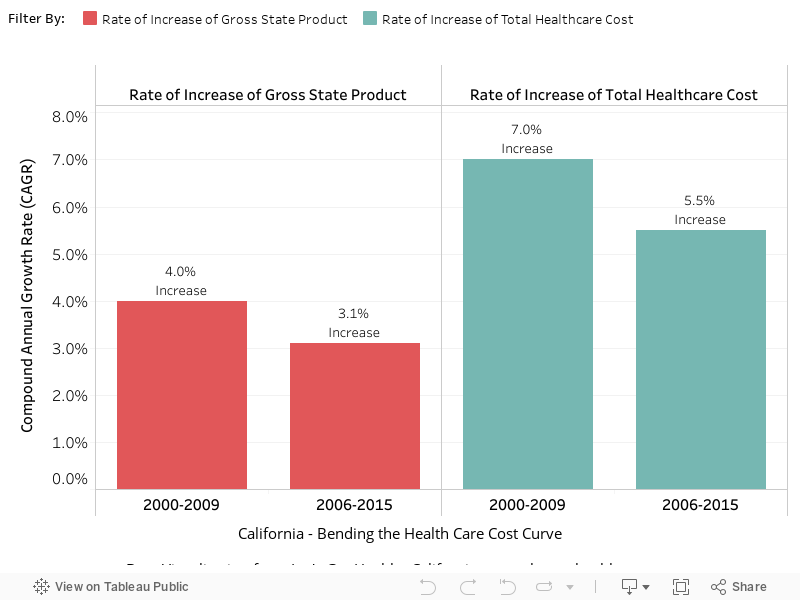
In 2012 (baseline year), the rate of increase of total healthcare cost was 7.0%. The most recent data available show 5.5% (2015). We hope to reach a target of no greater than the Compound Annual Growth Rate for Gross State Product by 2022.

More Data about Bending the Health Care Cost Curve, Compound Annual Growth Rate (CAGR) by Total Health Expenditures

Baseline

7.0%

Current Rate

5.5%

Target

See Text

Indicator Highlights

Data Snapshot: Trends & Disparities
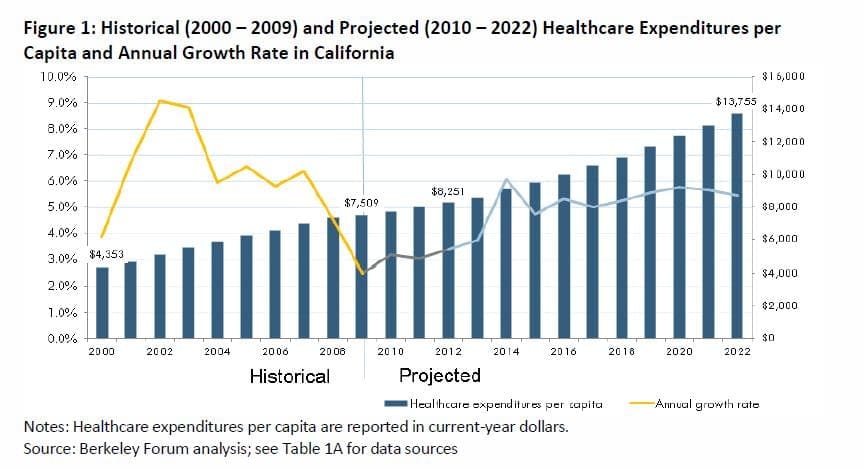
Compound Annual Growth Rate by Gross State Product and Total Healthcare Cost

The growth rate of health care expenditures is calculated over an interval of time. For this data visualization (below), the CAGR is displayed as a comparison of the most recent 10-year interval (2006-2015) with the 10-year interval calculated in the 2012 Task Force report (2000-2009). Viewing a broader interval increases stability of the CAGR output value.

|

Indicator: Compound annual growth rate (CAGR) of overall health care spending and per capita costs

Description: Compound annual growth rate is a calculation used to measure the average growth or decline in value over a given period of time (e.g. finding an average rate of growth in expenditures per year over ten years).

Indicator Source: The principal data sources for modeling the Cost Curve includes the Centers for Medicare & Medicaid Services’ (CMS) Health Expenditures by State of Residence and National Health Expenditures Projections, the Bureau of Economic Analysis’ state and national Gross Domestic Product (GDP) data, and the California Simulation of Insurance Markets model of the Affordable Care Act. The principal data sources for projecting premiums affordability includes the Berkeley Forum forecasts of health care expenditures, the Kaiser Family Foundation / California HealthCare Foundation’s Employer Health Benefits Survey and the U.S. Census Bureau’s Current Population Survey4

Data Limitations: The Berkeley Forum projections are based on historical trends and other forecasts, which are adjusted for the California context and the Affordable Care Act’s 2014 coverage expansion.

CMS provides historical data only for personal health care expenditures. Thus, to compare California health care spending with that in the United States as a whole, estimates of non-personal health care expenditures in California are needed.4

At the state level, the Bureau for Economic Analysis’ GDP data is grouped with health care and social assistance as one industry according to the 2007 North American Industry Classification System (NAICS). Although health care and social assistance costs overlap in many areas, the California CAGR calculations are not exclusively related to health care.

Data Collection Methodology: The Bureau of Economic Analysis collects gross domestic product (GDP) data by state quarterly by calendar year. The estimates of GDP by state are collected by using Census Bureau data on receipts, payroll, and company financials as well as various data sources relating to compensation of employees, taxes on production and imports, subsidies, and gross operating cost.5

For this indicator, CAGR of overall health spending was calculated using a 10-year increment. This was done to increase stability of the CAGR output value and allow a direct comparison with the baseline values calculated in the 2012 Task Force Report.

To project California’s personal health care expenditures, The Berkeley Forum applied the Centers for Medicare and Medicaid Services’ (CMS) US per capita personal health care expenditures growth rate projections to California, starting with California’s 2009 per capita figure. This approach was chosen because California personal health care expenditures growth has tracked the comparable US figure for almost twenty years.

Then, to obtain the projected California per capita personal health care expenditures figure, per capita non-personal health care expenditures estimate was added using CMS’ national projections. This assumption produced California projections for per capita state health care expenditures beginning in 2010. The above approach was used to obtain California projections through 2022, with slight modifications for 2013.4

1. Centers for Medicare and Medicaid Services. (2016, December). NHE Fact Sheet. Retrieved 14 February, 2017, from cms.gov: https://www.cms.gov/research-statistics-data-and-systems/statistics-trends-and-reports/nationalhealthexpenddata/nhe-fact-sheet.html

2. California HealthCare Foundation. (2015, November). Health Care Costs 101: Reaching a Spending Plateau? Retrieved 14 December, 2015, from chcf.org: https://www.chcf.org/~/media/MEDIA%20LIBRARY%20Files/PDF/PDF%20H/PDF%20HealthCareCosts15.pdf

3. Let’s Get Healthy California Task Force. (December 2012). Lets Get Healthy California Task Force Final Report.

4. Scheffler, R. M., & Bowers, G. L. (2013). A New Vision for California’s Healthcare System: Integrated Care with Aligned Financial Incentives. Berkeley: University of California, Berkeley. From https://berkeleyhealthcareforum.berkeley.edu/

5. U.S. Department of Commerce, Bureau of Economic Analysis. (2006). Gross Domestic Product by State Estimation Methodology. From: https://www.bea.gov/regional/pdf/gsp/GDPState.pdf

Share Your Story

Want to engage in moving the dial on the Lowering the Cost of Care goal? Share your impact story!

Submit Your Story