Vaccines: defense against infectious diseases1
One of public health’s greatest accomplishments is the development of vaccines. These immunizations help keep children from getting certain dangerous vaccine-preventable diseases. California continues to work to improve the number of children vaccinated with up-to-date coverage for the ages of 19-35 months.
One of the State’s biggest barriers to reaching the Let’s Get Healthy California 80% target by 2022 is false information and fears surrounding the long term effect and dangers of vaccinations. Despite recent challenges including public protests, progress continues to be made through collaboration between parents, childcare providers, medical providers, and other key stakeholders.
Indicator Progress
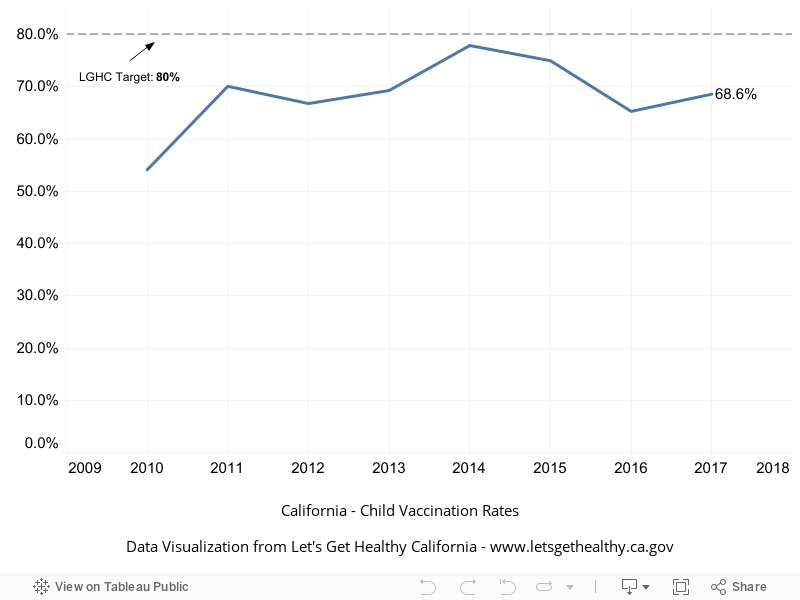
In 2010 (baseline year), 54.1% of children ages 19-35 months were up-to-date on vaccinations. The most recent data available show 68.6% (2017). We hope to reach a target of 80.0% or higher by 2022.
Baseline
54.1%
Target
80.0%
Indicator Highlights
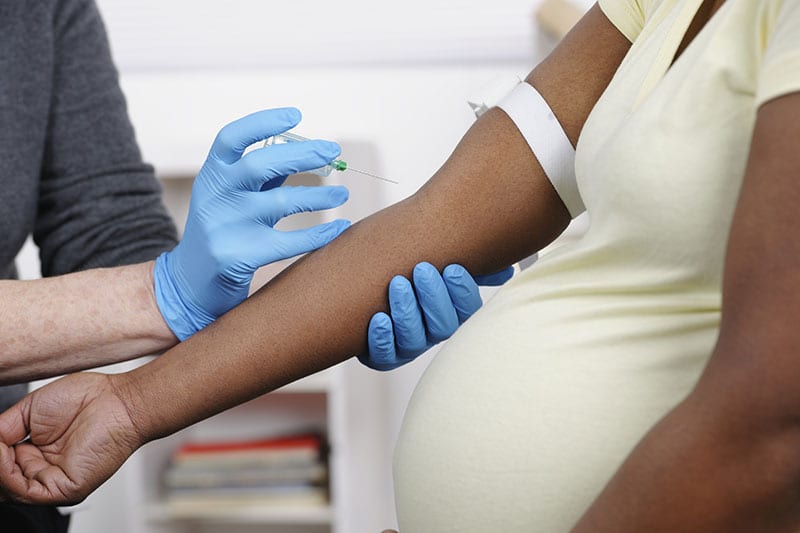
Increasing Tdap Vaccination Among Pregnant Medi-Cal Women In Los Angeles County
The mission and vision of this pilot project is to promote best practices and optimize maternal and child health outcomes in San Fernando Valley specifically among Hispanic mothers. This innovation addresses the need for formal procedures to consistently offer Tdap vaccinations to pregnant women in their third trimester among Comprehensive Perinatal Services Program (CPSP) providers in Los Angeles County (LAC). A multifaceted approach was used by the CPSP team to improve staff knowledge and awareness about the challenges of pertussis and to ensure patients were educated and offered the vaccine in a consistent manner. Implementation of this program resulted in a 74 percent increase of Tdap vaccination rates over an eight month period. Read more »
Proportion of Children 19-35 Months Who Have Received All Recommended Vaccinations, Over Time
|
Stories & Solutions

Clinic in the Park • Connect • Screen • Educate
The Clinic in the Park is a health collaborative consisting of over 40 community nonprofits, academic, private and public organizations, volunteer health and public health professionals that brings free health and wellness screenings to needy families during the weekend at parks throughout Orange County.
Increasing Tdap Vaccination Among Pregnant Medi-Cal Women In Los Angeles County
The mission and vision of this pilot project is to promote best practices and optimize maternal and child health outcomes in San Fernando Valley specifically among Hispanic mothers.
Text4baby
The Text4baby app provides free text messages to help keep you and your baby healthy.
Share Your Story
Want to engage in moving the dial on Healthy Beginnings? Share your impact story!


