Nearly one out of eight Californians live in poverty.1
Everyone has a right to live a healthy life with easy access to meet their basic needs. Some communities, however, have a higher risk of being in poverty from factors that are beyond their control, such as institutional and structural racism, discrimination, and reduced access to stable housing, healthy foods, and safe neighborhoods. Poverty can also limit an individual’s access to educational and employment opportunities, further contributing to income inequality and prolonging cyclical and generational effects of poverty. Poverty is associated with societal exclusion and higher prevalence of mental illness as well as higher rates of chronic diseases and premature death. Strategies to improve economic mobility of families may help alleviate the negative impacts of poverty and break the generational cycle of poverty.22
There are many ways to measure poverty. The California Poverty Measure (CPM) tracks the percent of residents living in poverty, taking into account income, cost of living, and social safety net benefits.
Poverty
In the first quarter of 2023 (baseline time range), 13.2% of Californians lived in poverty. The most recent rate available is 13.2% (first quarter of 2023). The target is to be determined (TBD) for this indicator.
Baseline
13.2%
Target
TBD
Indicator Highlights
Meeting Basic Needs
Nearly one in eight Californians—about 5 million people—lacked sufficient financial resources to meet basic needs.1
Working Poor
Most poor families in California are working families. Just over three in four (76%) poor Californians lived in families with at least one working adult.1
Without social safety net programs, more Californians would live in poverty, especially in the Inland Empire, Central Valley and Sierra. The largest social safety net programs kept an estimated 7.8% of Californians out of poverty.3
Safety net programs reduce poverty much more in inland areas: if we subtract these resources from family budgets, 13.9% more people in the Central Valley and Sierra would be poor, compared with 4.0% more in the Bay Area.3
Data Snapshot
In the first quarter of 2023, the poverty rate for 25–64 year-old Californians with a college degree (6.4%) was lower compared to those without a high school diploma (22.3%).1
Among working adults age 25-64 years old, 8.1% were poor, with rates much higher among those working part time (18.5%) as opposed to full time (5.3%).1
The poverty rate for foreign-born Californians was 17.6%, compared to 11.5% for US-born residents; poverty among undocumented immigrants was 29.6%.1
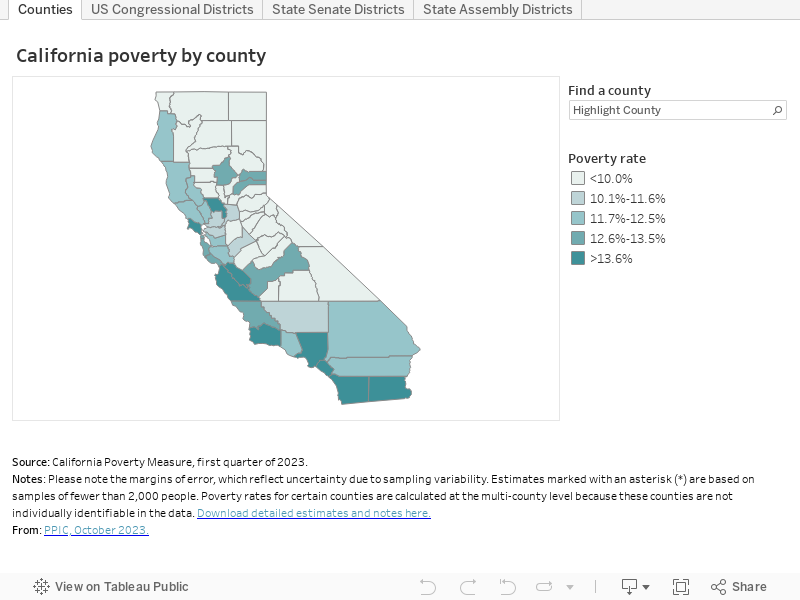
The counties of Yolo (19.5%) and Santa Barbara (16.9%) had the highest poverty rates in California. Merced County had the lowest rate (7.7%).1
Rates vary even more widely (from 6.1% to 26.1%) across legislative districts.1
In early 2023, the poverty rate was markedly higher for older adults 65 years and over (15.2%) compared to children (13.8%) and adults 18-64 years old (12.6%).1
Latinos, in general, remain disproportionately poor, making up about half (50.7%) of poor Californians but only over a third (39.7%) of all Californians.1
Poverty rates vary dramatically within racial/ethnic groups, with Central Americans (21.1%) and Middle Eastern/North Africans (20.3%) having the highest rates.1
Percent of Residents Living in Poverty Based on California Poverty Measure, by County and Legislative District
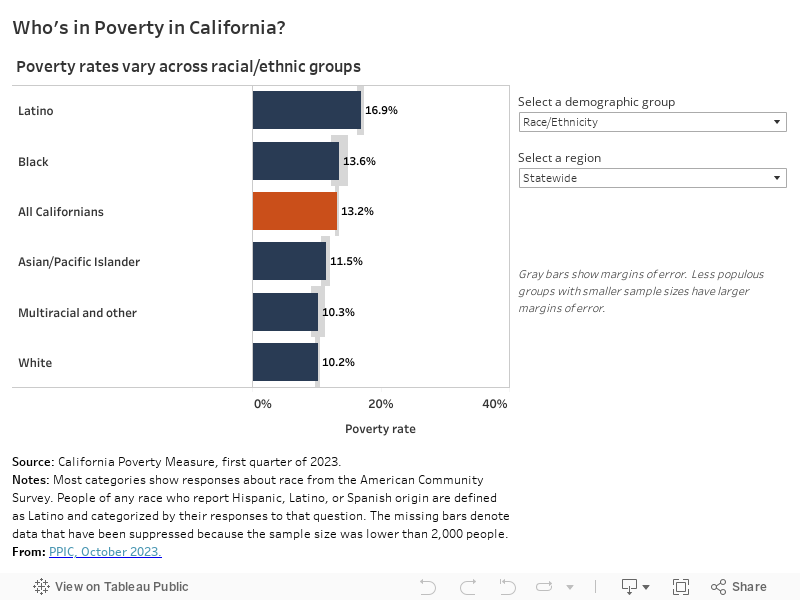
Percent of Residents Living in Poverty Based on California Poverty Measure, by Demographic Category
|
Stories & Solutions
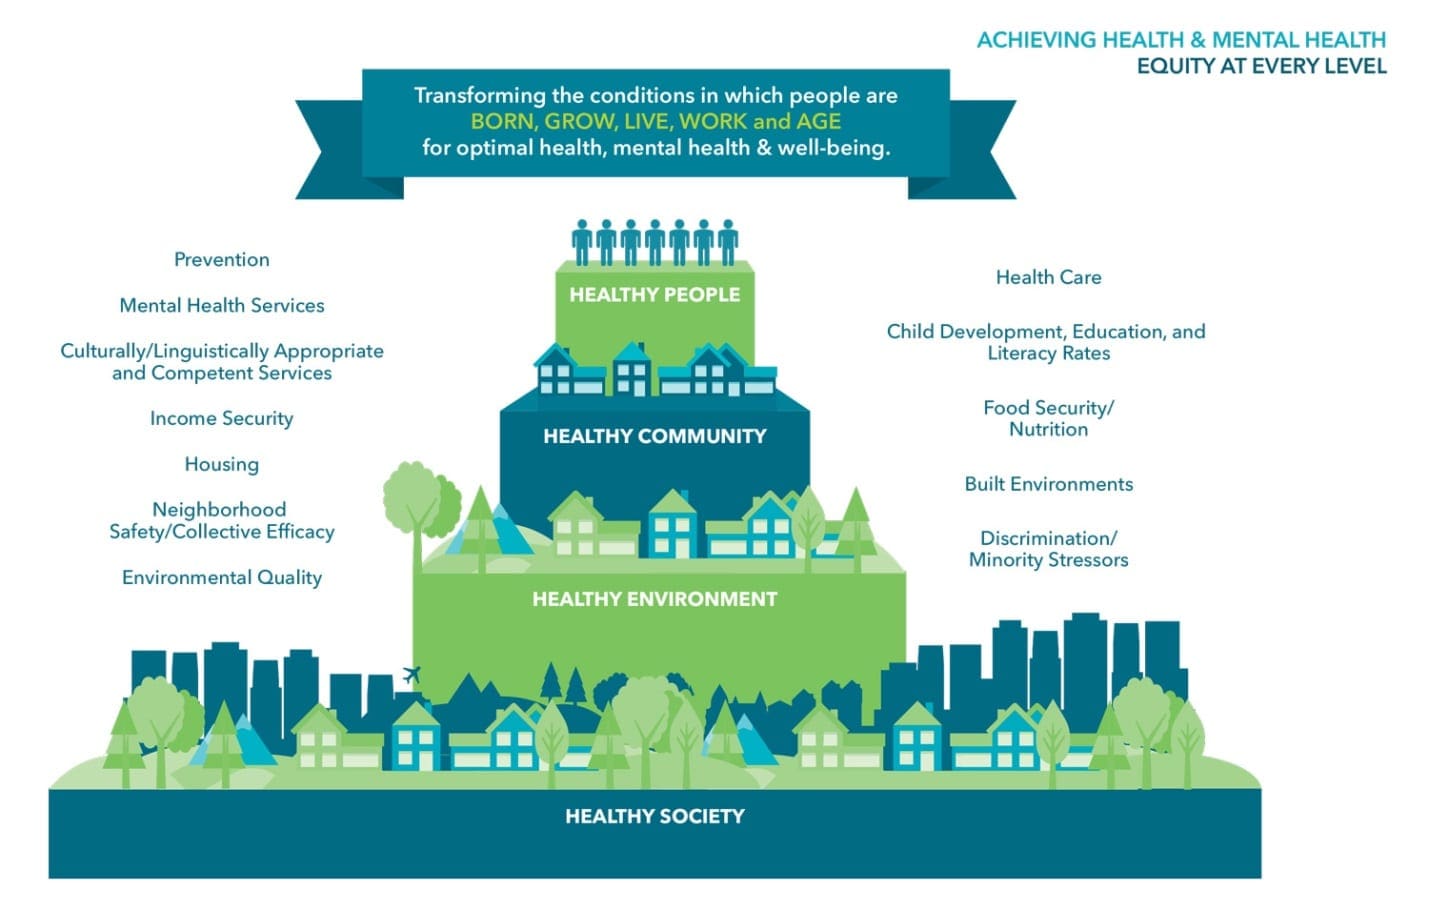
Social Determinants of Health
What Are Social Determinants of Health? The social determinants of health are the conditions in which we live, learn, work, and play.1 These conditions include a broad range of socioeconomic and environmental factors, such as air and water quality, the quality of the built environment (e.g., housing quality; land [...]

Food Security
How can we provide access to nutritious food for the 5.4 million Californians who experience food insecurity?

Early Childhood Well-being
How can we promote safe, stable, nurturing relationships and environments for healthy development?

Access to Services
How can we improve access to services that support health and enhance quality of life for Californians?

Community Cohesion and Violence Prevention
How can we create safe, connected, communities free of violence?

Access to Quality Care
How can all Californians achieve access to affordable, high-quality healthcare?

Clinical-Community Linkages
How can we build connections between health care systems, public health, and community partners?
Share Your Story
Want to engage in moving the dial in Creating Healthy Communities? Share your impact story!
More From Let’s Get Healthy California

Get Informed
- Poverty in California
- Reducing Child Poverty in California: A Look at Housing Costs, Wages, and the Safety Net
- California’s Cash-Based Safety Net – Public Policy Institute of California (ppic.org)
- California’s Nutrition Safety Net – Public Policy Institute of California
- The Working Poor in California
- Income Inequality in California – Public Policy Institute of California (ppic.org)


Get Data
- Who’s in Poverty in California? – Public Policy Institute of California
- California Poverty by County and Legislative District – Public Policy Institute of California (downloadable data also includes child poverty rate by county)