Safe streets make communities healthier1
Increasing the amount of walking trips an individual makes can help meet recommended physical activity goals and improve fitness.2 Neighborhoods and workplaces should have the infrastructure to support those activities.6
This indicator shows the percent of individuals that walk to work.
This data is being presented as an alternative indicator for the original “Annual number of walk trips per capita” which was from a national survey that is no longer available. Exploration of additional data is underway to develop more comprehensive measures of walk trips per capita in California.
Indicator Progress
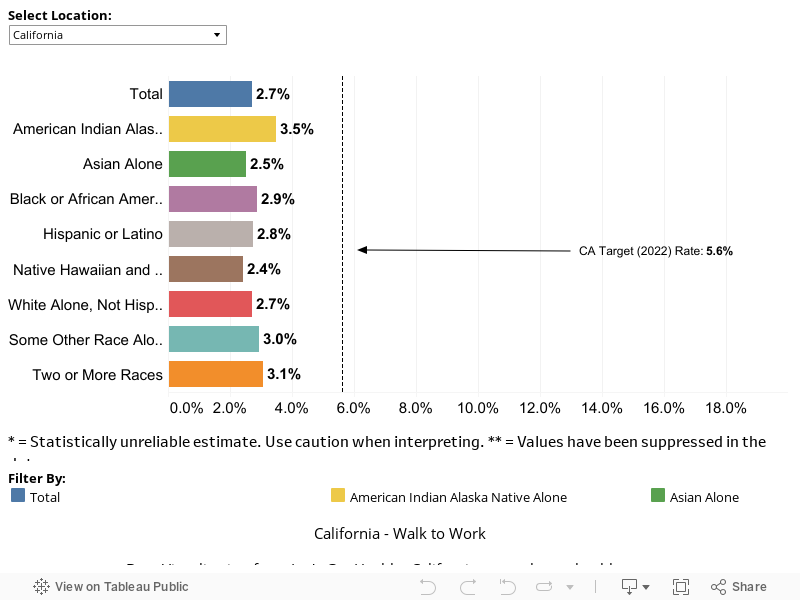
In 2006-2010 (baseline period), 2.8% of Californians reported walking to work. The most recent data available show 2.7% (2011-2015). We hope to reach a target of 5.6% by 2022.
Walk Trips
Note: The indicator and data source have changed from the original LGHC 2012 Task Force Report as the original data source is no longer available. Walk to Work data is included as a proxy measure, but only represents a subset of walk trips. A new baseline and target will need to be developed for the new source.
Baseline
2.8%
Target
5.6%
Indicator Highlights
A Culture of Health: Creation of the Healthy RC Steering Committee
The City of Rancho Cucamonga developed a steering committee comprised of community residents and city officials. The steering committee conducts assessments of resident feedback on various areas of health to provide direction for local community goals. As part of a broader community health plan, residents have provided feedback on how to improve infrastructure for physical activity in Rancho Cucamonga. Read more »
Active Design Guidelines and Icon
The County of Sacramento’s Active Design Guidelines and Icon innovation incorporates the use of active design strategies and guidelines to support and foster physical activity among its residents through the use of neighborhood design and strategic land use. Read more »
Only half of adults and about a quarter of high school students get the amount of physical activity recommended in national guidelines.3
Nearly one in four California adults report that they do not engage in physical activity.4
Active modes of transport – bicycling and walking alone and in combination with public transit – offer opportunities for physical activity, which is associated with lower rates of heart disease and stroke, diabetes, colon and breast cancer, dementia, and depression.5
Promoting optimal health before disease occurs: “As Americans, we lead the world in treating disease. As America’s Doctor, I believe we must also lead the world in preventing disease.” Surgeon General Vivek Murphy.3
Being physically active is one of the most important steps that Americans of all ages can take to improve their health.3
Disparities & Trends
Many studies have demonstrated that where we live plays a major role in our health. A variety of community conditions, sometimes called physical or environmental factors, improve or create barriers to health.1
People who live in highly walkable, safe, mixed-use communities with easy access to green space and public transit options have higher levels of physical activity and a lower body mass index (BMI).6
People in low-income communities have lower activity levels and higher BMI, due in part to their greater neighborhood barriers to physical activity.6
Increasing participation in active transportation puts more people on the road and can lead to increased risk of injury for pedestrians.6
Traffic-related injuries and deaths especially impact vulnerable populations such as older adults, children, communities of color, and low-income communities.6
The health benefits of active transportation at the population level outweigh the potential harm from increased pedestrian injuries.8
Percentage of Residents Who Walk to Work, by Demographic Category
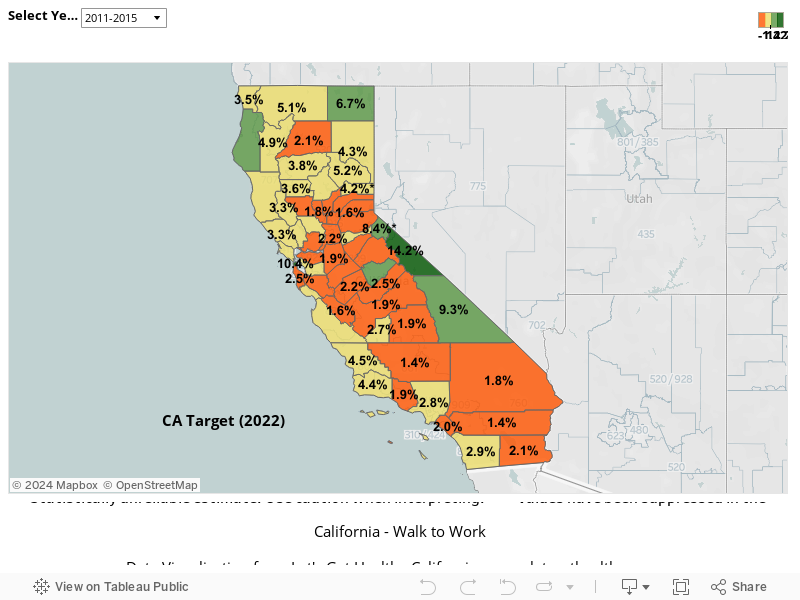
Percentage of Residents Who Walk to Work, by County
|
Stories & Solutions
A Culture of Health: Creation of the Healthy RC Steering Committee
The City of Rancho Cucamonga developed a steering committee comprised of community residents and city officials.
Step it Up! The Surgeon General’s Call to Action to Promote Walking and Walkable Communities
Step It Up! The Surgeon General’s Call to Action to Promote Walking and Walkable Communities aims to get Americans walking and wheelchair rolling for the physical activity needed to help prevent and reduce their risk of chronic diseases and premature death. And it supports positive mental health and healthy aging [...]
Walking to promote health of people at all ages and stages of life
"Walking is the most common activity of teens and adults. It requires no specialized skills or equipment and is a great first step (pun intended) for anyone who has been inactive. Taking a walk with family or friends can help our emotional well-being and connect us to our communities. And [...]
Make Communities More Walkable
"For some, access to safe places to walk isn’t so simple. Without well-connected sidewalks and paths, or nearby destinations, our daily decision to walk or roll can be a bit tough. And that is especially true for people who need to use assistive devices or wheelchairs. We need access to [...]
Collaborating to Create Walkable Communities
"Everyone should have access to spaces and places that make it safe and easy for us to walk or wheelchair roll—whether in urban, suburban, or rural settings. This means that the people who design our cities and neighborhoods should include well-maintained sidewalks, pedestrian-friendly streets, access to public transit, adequate lighting, [...]
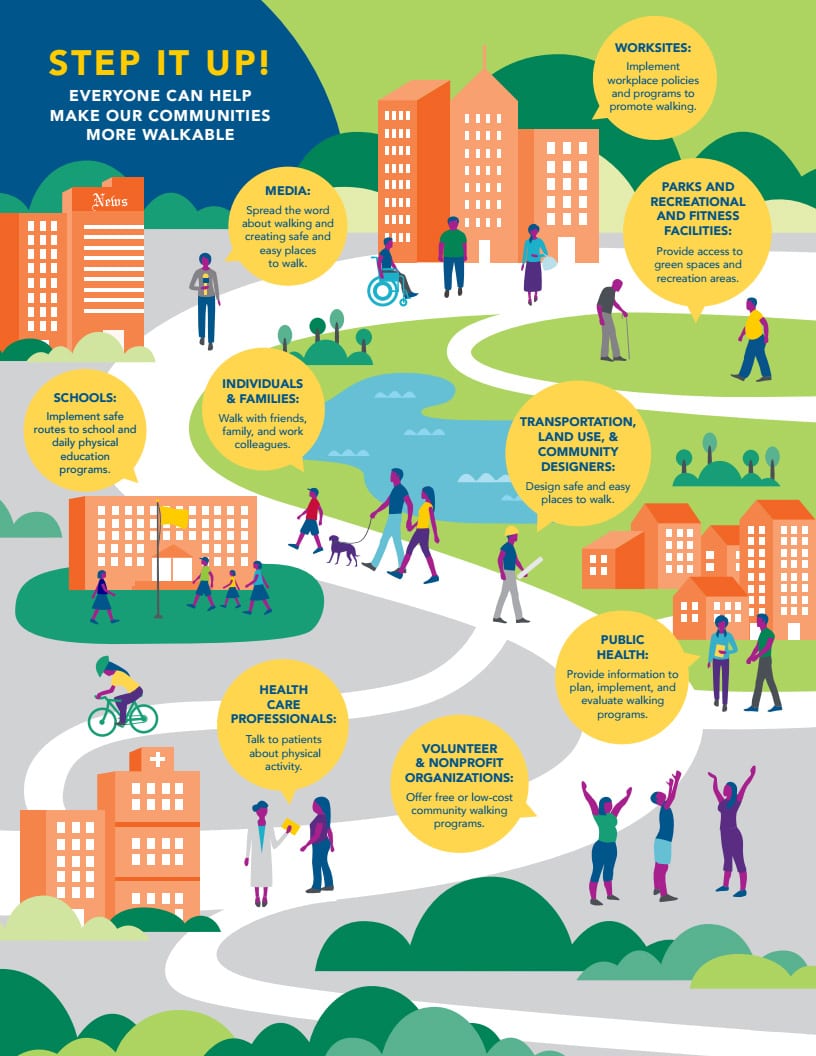
Everyone can make our communities more walkable
See easy roles for every sector to contribute, including: media, worksites, schools, individuals and families, transportation, land use and community designers, health care professionals, volunteer and nonprofit organizations, public health, parks and recreational facilities.
Share Your Story
Want to engage in moving the dial on the Creating Healthy Communities goal? Share your impact story!


