California spends billions each year on hospital-acquired infections1
Hospital acquired conditions are complications such as injuries or infections that can occur in the course of receiving healthcare services.2 Measuring the incidence of hospital acquired conditions is one way to assess healthcare safety. With sustained and system-wide quality improvement efforts in hospitals, safety and quality of care for patients can be enhanced and billions of dollars saved.
This indicator tracks the incidence of measurable hospital-acquired conditions (per 1,000 discharges). It is a composite patient safety indicator that is an average of the observed-to-expected ratios of several other selected indicators of quality. The available data is not a definitive measure of hospital quality and there may be opportunities for further development to establish a more definitive measure.
Hospital Acquired Conditions
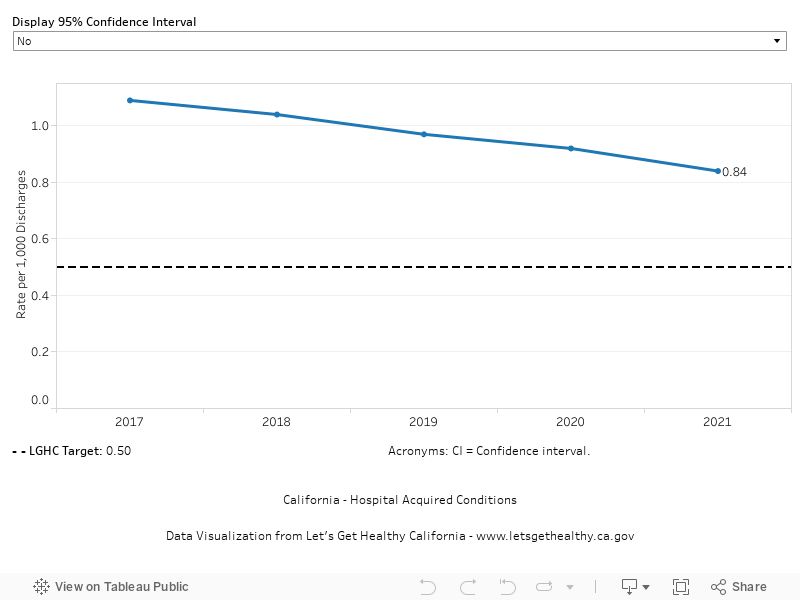
In 2021 (baseline year), there were 0.84 hospital-acquired conditions per 1,000 discharges. The most recent rate available is 0.84 (2021). We hope to reach a target of 0.50 or lower by 2034.
More Data about Hospital Acquired Conditions
Hospital Acquired Conditions
Note: Due to the incorporation of ICD-10 codes and other factors into the measure composition, values for this indicator (include baseline) will likely change next year.
Baseline
0.84
Target
0.50
Indicator Highlights

Healthcare Associated Infections Program (HAI)
Healthcare Associated Infections (HAI) Program is part of the Center for Health Care Quality of the California Department of Public Health. The Program was created by mandate to oversee the prevention, surveillance and reporting of healthcare-associated infections in California’s general acute care hospitals.
HAIs are the most common complication of hospital care. The vision of the HAI Program is to eliminate HAIs for all Californians. The HAI Program produces annual public reports of hospital HAI data to inform choices of healthcare consumers and prompt providers to take actions to prevent infections; actively engages in HAI prevention by performing site visits to hospitals with high infection rates, convening prevention collaboratives, and provides infection prevention education; and consultation and assistance to local public health for infection outbreaks that occur in healthcare facilities.
Healthcare associated infections (HAIs) result in an estimated $3.1 billion in excess healthcare costs in California and $28-$45 billion nationally each year.1,3
Healthcare-associated Infections (HAIs) are common, affecting 1 in 25 hospital patients during the course of their hospital care.2
Consistent use of evidence-based infection prevention approaches in health care settings can reduce hospital acquired infections.2
Following antibiotic stewardship best practices can reduce antimicrobial resistance.4
Data Snapshot
Three hospitals with higher rates of hospital acquired infection than the national baseline are located in California’s Central Valley and Southern California.6
Asian, Black, and Latino patients have a higher incidence of certain hospital-acquired infections relative to White patients.5
The rate of hospital acquired infections has consistently decreased over time.
Incidence of Hospital-Acquired Conditions per 1,000 Discharges, Over Time
|
Share Your Story
Want to engage in moving the dial on the Redesigning the Health System goal? Share your impact story!


