Sugar-sweetened beverages are associated with increased rates of obesity and other chronic health conditions1
One approach to improving the overall health of Californians is to improve diet. Many Californians are looking closer at their drink choices as sugar-sweetened beverages (SSBs) are one of the largest sources of added sugar in our diets.1 Sugary drinks are defined as liquids that are sweetened with various forms of sugars that add calories. These beverages include, but are not limited to, soda, fruit-ades and fruit drinks, and sports and energy drinks. This indicator is measured by the number of adults who drank two or more sodas or other sugary drinks per day, The Let’s Get Healthy California aim is to reduce the number of Californians who drink two or more SSBs per day by half.2
Indicator Progress
In 2013 (baseline year), 7.1% of adults drank two or more sugar-sweetened beverages daily. The current value in 2015 was 7.8%. The updated 2034 target is to be determined (TBD).
More Data about Sugary Beverage Consumption – Adult
Adult Sugary Beverage Consumption
Note: The baseline has changed from the original LGHC 2012 Task Force Report due to changes in survey methodology of the data source in 2011.
Baseline
7.1%
Target
TBD
Indicator Highlights
Street Vendors: Bringing Healthy Food to Central Valley Residents
The Vendors of Health innovation in Southeast Fresno was developed by Cultiva la Salud, a program of the Public Health Institute. The innovation involves a coordinated effort by community residents, mobile vendors, elected officials, the media, community stakeholders, and city planners, to initiate a Buy Local promotional campaign to institute zoning code changes to allow healthy food to be sold in more locations, to develop a community kitchen and commissary for mobile food vendors to safely prepare food, and to facilitate residential town hall meetings and focus groups to help inform the program and ensure its success in creating a healthier Central Valley. Read more »
Sugary drinks are the single largest food category contributing added sugar to the American diet.3
Consumption of excess calories requires additional physical activity to keep from gaining weight. A 154 lb. individual would have to walk for nearly an hour to burn off the 227 calories in a 20‐ounce soda.4
Data Snapshot: Disparities & Trends
Low‐income persons consume more sugary drinks in relation to their overall diet than those with higher income.5
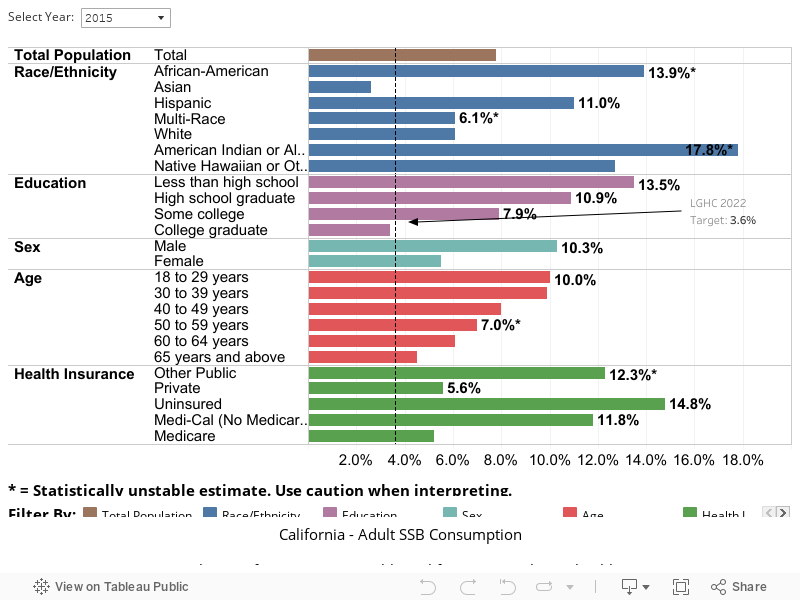
Proportion of Adults Who Drank Two or More Sodas or Other Sugary Drinks per Day, by Demographic Category
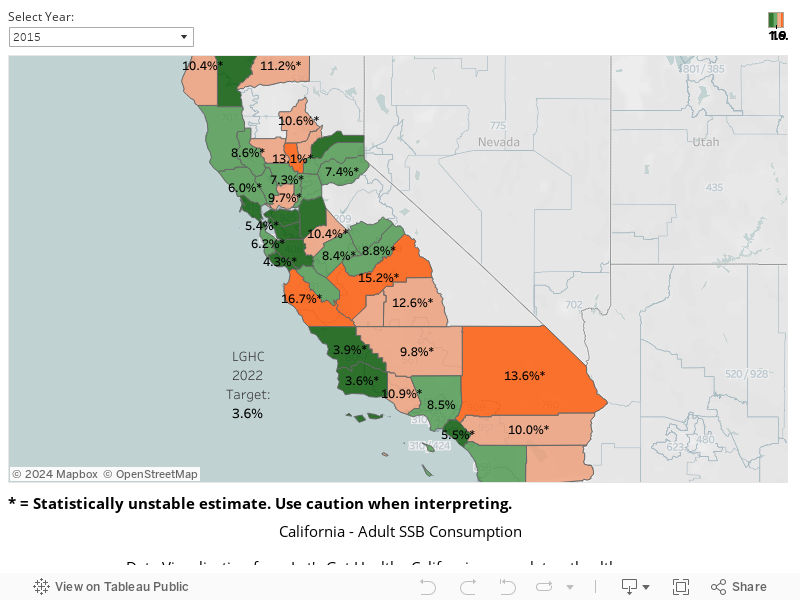
Proportion of Adults Who Drank Two or More Sodas or Other Sugary Drinks per Day, by County
|
Stories & Solutions
Street Vendors: Bringing Healthy Food to Central Valley Residents
The Vendors of Health innovation in Southeast Fresno was developed by Cultiva la Salud, a program of the Public Health Institute.
Rethink Your Drink
This public health initiative aims to educate low-income Californians about healthy drink options, help identify drinks with added sugar, and make the link between consumption of sugar-sweetened drinks and health risks.
Share Your Story
Want to engage in moving the dial on the Living Well goal? Share your impact story!


