Healthy Beginnings / Reducing Adolescent Sugar-Sweetened Beverage Consumption

Healthy Diets – Adolescent Sugar-Sweetened Beverage Consumption2022-02-01T15:27:46-08:00

Sugar-sweetened beverages are the largest source of added sugar to our diets1

Adolescent sugar-sweetened beverage consumption is measured by the number of adolescents who drank two or more glasses of soda or other sugar drink the previous day. Compared with other age groups, adolescents consume more sugar-sweetened beverages. The added sugar in our diets from these beverages is associated with increased rates of obesity and other chronic health conditions.1

Consumption of sugar-sweetened beverages increases from young childhood through adolescence with the proportion drinking two or more sugar-sweetened beverages daily starting at 4.4% in early childhood (2-5 year olds) and increasing to 20-30% in adolescents (12 to 17 years old).2

Indicator Progress

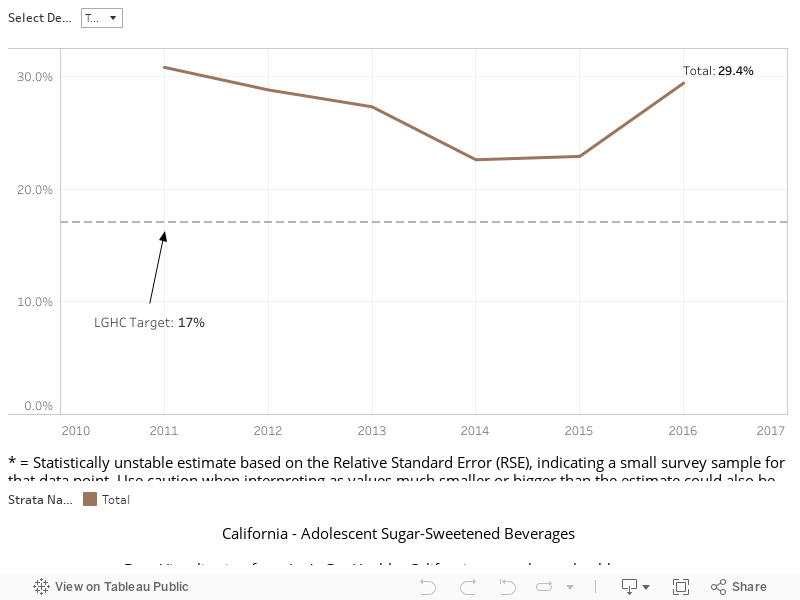
The 2009 (baseline year) for the percentage of teens (ages 12-17) drinking two or more sugar-sweetened beverages daily is 27.3%. We are at 29.4% in 2016 and hope to reach a goal of 17.0% or below by 2022.

More Data about Adolescent Sugar-Sweetened Beverage Consumption

Baseline

27.3%

Current Rate

29.4%

Target

17.0%

Proportion of Adolescents Who Drank Two or More Glasses of Soda or Other Sugary Drink Yesterday, Over Time

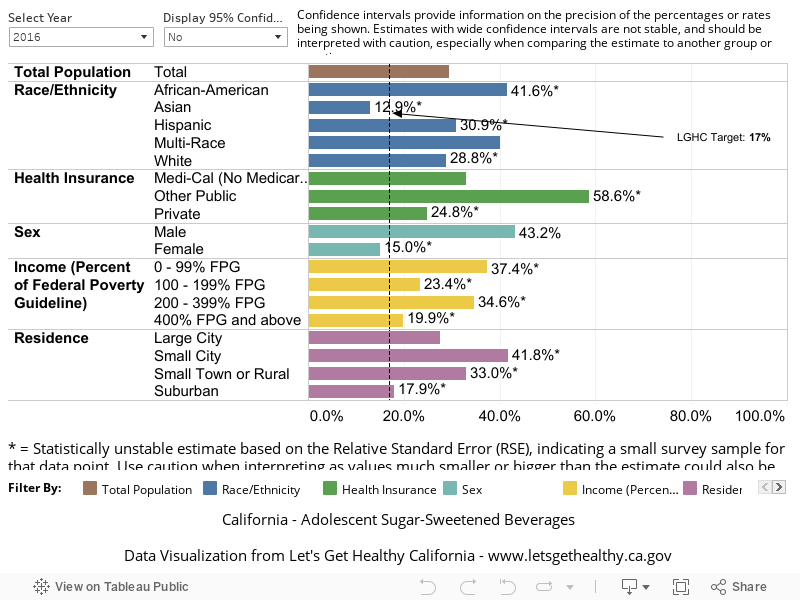
Proportion of Adolescents Who Drank Two or More Glasses of Soda or Other Sugary Drink Yesterday, by Demographic Category

|

Indicator: Adolescents who drank 2 or more glasses of soda or other sugary drink yesterday

Description: Adolescents (i.e. teens) (age 12-17) asked about how many glasses of sugary drinks including soda they consumed yesterday

Data Limitations: Asked of California’s residential population (adults, teens, and children), administered in English, Spanish, Chinese, Korean, Tagalog, and Vietnamese. Does not include those living in group quarters or homeless persons.

Indicator Source: California Health Interview Survey (CHIS) is a biennial population-based, omnibus health survey of California. It is the largest telephone survey in California and the largest state health survey in the country. Note that this indicator uses weighted data.

Data Sharing Agreement: Researchers can access a variety of publicly available CHIS data files and web tools. These CHIS data products include downloadable data sets and easy-to-read PDF documents. In addition, local county health departments can request data files specific to their county. However, researchers can apply to analyze confidential CHIS data, data sensitive variables and/or geo-coded data through the CHIS Data Access Center (DAC). Access to confidential CHIS data requires a research application, review, and approval.

Indicator Calculation Methodology:
https://healthpolicy.ucla.edu/chis/design/Pages/overview.aspx

Data Collection Methodology:
https://healthpolicy.ucla.edu/chis/design/Pages/methodology.aspx

Program URL Link:
https://healthpolicy.ucla.edu/chis/Pages/default.aspx

1. Backman, D., Lee, P., & Paciotti, B. (2013). Health Disparities in the Medi-Cal Population. Retrieved November 17, 2015, from www.dhcs.ca.gov: https://www.dhcs.ca.gov/dataandstats/Documents/HealthDisparities.pdf

2. Nutrition Education and Obesity Prevention Branch. (2014). Obesity in California: The Weight of the State. California Department of Public Health .Weblink: https://www.cdph.ca.gov/programs/cpns/Documents/ObesityinCaliforniaReport.pdf

Stories & Solutions

Rethink Your Drink

This public health initiative aims to educate low-income Californians about healthy drink options, help identify drinks with added sugar, and make the link between consumption of sugar-sweetened drinks and health risks.

Share Your Story

Want to engage in moving the dial on Healthy Beginnings? Share your impact story!

Submit Your Story

Go to Top