The nation spends billions annually on preventable hospitalizations1
Hospitalization is costly, stressful for patients, and carries a risk of adverse health outcomes.1,2 Preventable hospitalizations are hospitalizations for conditions that can be safely managed in an outpatient setting through access to high-quality preventative care, such as diabetes and hypertension.1
This indicator tracks the rate of preventable hospitalizations (per 100,000 population) using a composite measure based on ten ambulatory care-sensitive conditions.
Preventable Hospitalizations
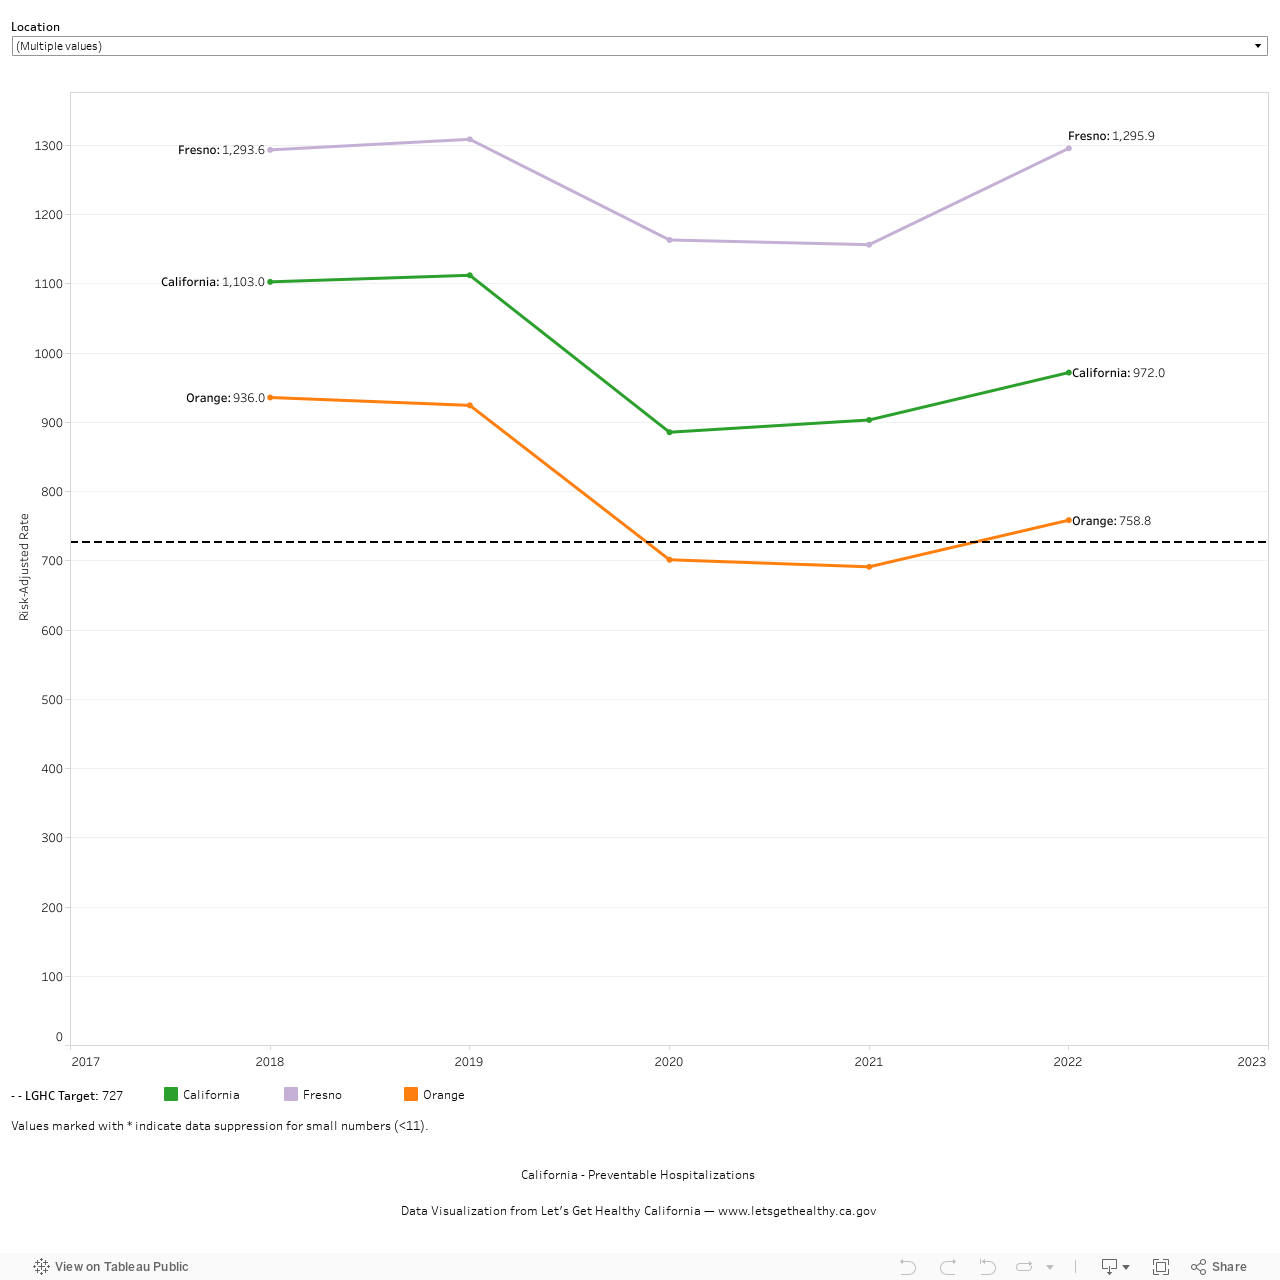
In 2022 (baseline year), there were 972 preventable hospitalizations for selected conditions per 100,000 population. The most recent rate available is 972 (2022). We hope to reach a target of 727 or lower by 2034.
Baseline
972
Target
727
Indicator Highlights
In 2019, the cost of hospital care accounted for 31% of total health care spending in the US.2
The United States spends tens of billions of dollars annually on hospitalizations that are potentially preventable with better outpatient care.1
Older adults are at greater risk for adverse health outcomes associated with hospital stays.3
Primary care lowers the risk of preventable hospitalizations.4
Investing locally in social services is linked to lower rates of preventable hospitalization5
Data Snapshot
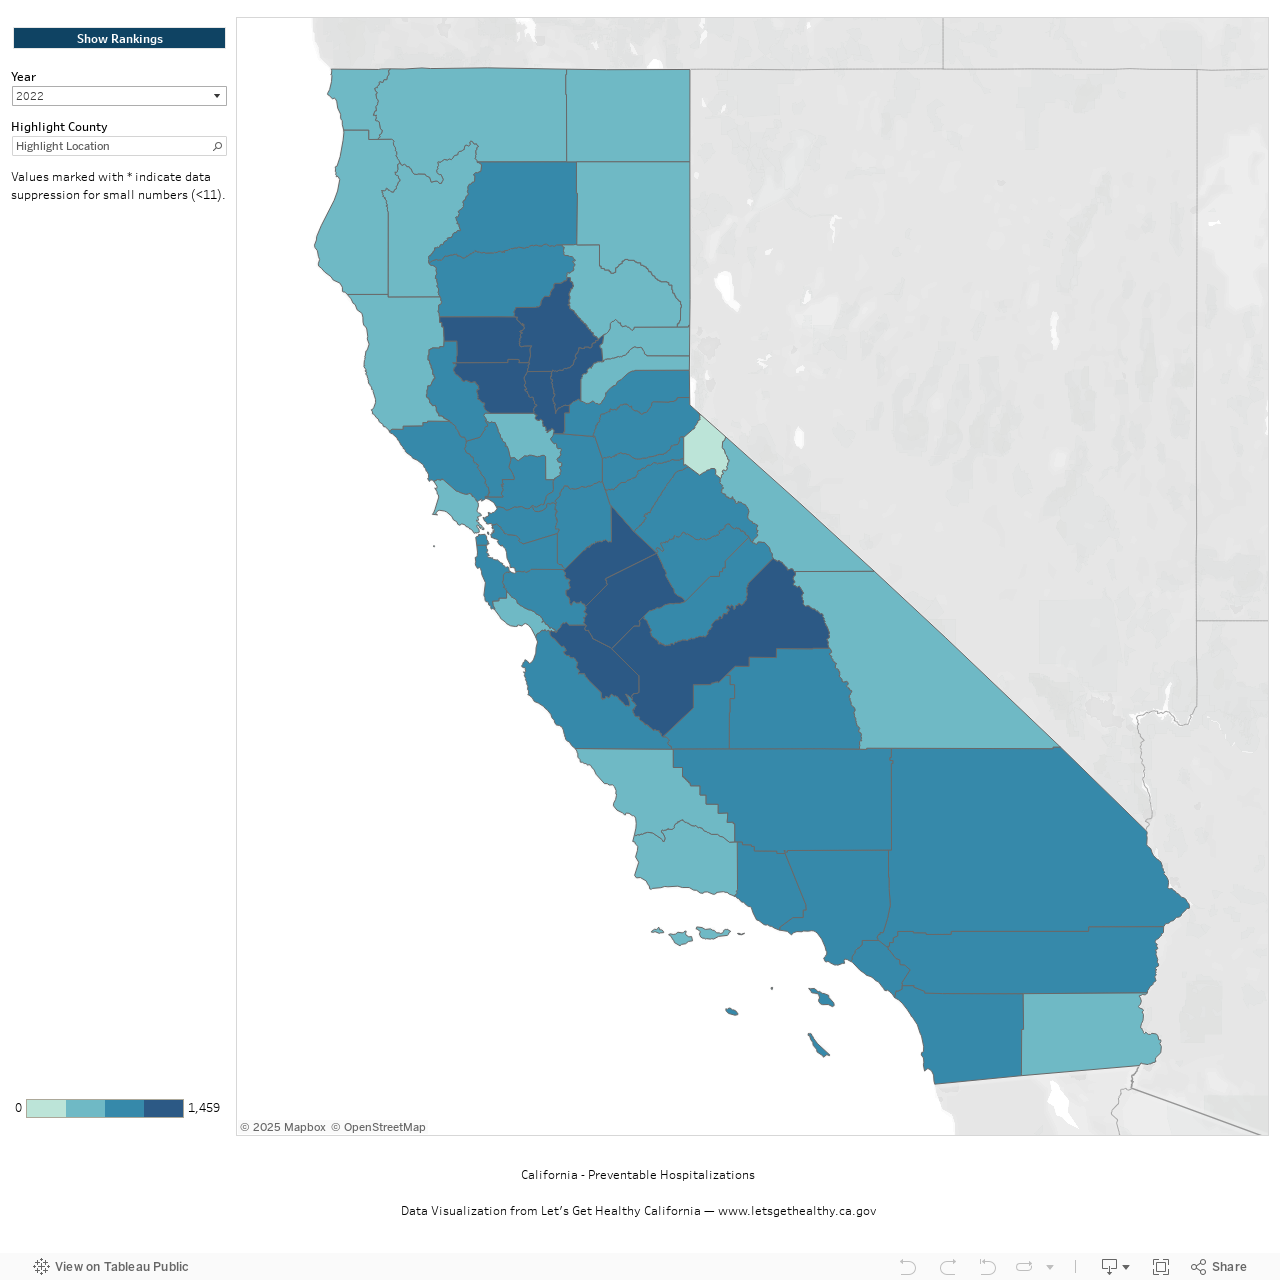
In 2022, preventable hospitalization rates were higher than the state rate for 22 California counties, most of which are located in California’s Inland Empire and Central Valley.
Preventable hospitalizations occur for Black Californians at a rate more than twice as high as that for White Californians.6
The risk-adjusted rate of preventable hospitalizations for California has largely been decreasing since 2016, including a sharp decrease in the context of the COVID-19 pandemic in 2020, followed by a rebound in 2021.
Preventable Hospitalizations per 100,000 Population, Over Time
Preventable Hospitalizations per 100,000 Population, by County
|
Share Your Story
Want to engage in moving the dial on the Redesigning the Health System goal? Share your impact story!


