A stable job with fair pay leads to better health.1
Stable employment allows people to afford the goods and services that are necessary to meet basic needs and wellbeing. Economic opportunity, especially having a job, is one the most powerful predictors of good health.2 Unemployment, especially for people in or near poverty, is associated with higher rates of stress-related illnesses and increased mortality.3,4 These negative health outcomes affect not only the unemployed persons but can extend to their families. Longer unemployment can increase risk of these negative health effects.3
This indicator tracks the percentage of labor force who are unemployed.3
Unemployment
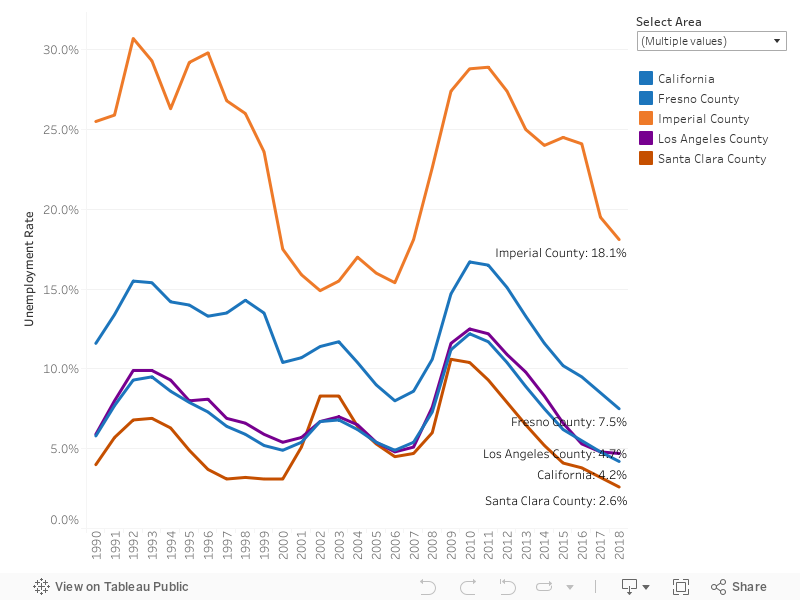
In 2011, 11.7% of Californian’s were unemployed. The current value in 2018 was 4.2%. The updated 2034 target is to be determined (TBD).
Baseline
11.7%
Target
TBD
Indicator Highlights
In the last six years, employment in California grew 12.7%, with the labor market nearing full employment at pre-recession levels and outpacing growth in the working-age population, which increased by 6.9%.5
Of those who remain unemployed, more than one-quarter (26.0%) have been looking for work for six months or longer, and 16.9% have been looking for a year or longer.5
Laid-off workers are 54% more likely to have fair or poor health, compared to those who are continuously employed.1
In 2017, nearly 2 million Californians age 25–64 were working but still in poverty (12.2% of working adults in that age group). About two-thirds were employed year round, with 45% working full time and 21% working part time; another third worked less than a full year.6
Raising the minimum wage—as the state has recently done—may help some working poor adults.6
Policies that promote more predictable work schedules and support access to childcare could help working parents maintain and expand their employment hours.6
Access to high-quality education and training programs can improving career prospects throughout the California workforce.6
Data Snapshot: Trends & Disparities
Studies have found that there is a greater likelihood that a person with disabilities will suffer long-term unemployment compared to a person without disabilities.7
More recent veterans, typically termed Post-9/11, tend to face higher levels of long-term unemployment 7
Individuals with less education often have fewer employment choices, which may force them into positions with low levels of control, job insecurity, and low wages.4
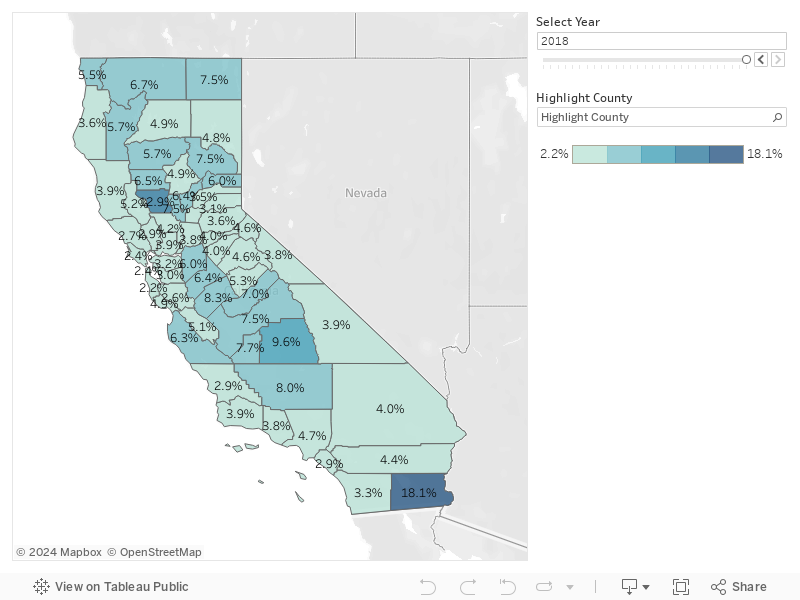
Unemployment rate is highest in Imperial county (19.1%) compared to the lowest in San Mateo county (2.7%).
Large, coastal areas currently have unemployment rates below the California rate of 4.8%. In contrast, many parts of the San Joaquin Valley have unemployment rates nearly twice the statewide rate.
Factors beyond full-time employment (cost of living, access to safety net resources) can make it difficult for working adults to make ends meet. For working adults the highest poverty rates are in Los Angeles County (15%) and Orange County (14%), while the Sacramento area (9%) and the Central Valley and Sierra counties (10%) have the lowest rates.6
Economic stability varies dramatically by employment status: among year-round workers, nearly a quarter (24%) of part-timers were in poverty, compared to only 8% of full-timers.6
Across age groups, workers younger than 25 are the most likely to be working part-time involuntarily (18.9%)—by contrast, only about 6% of workers 25 and older are working part-time involuntarily.7
Latinos are overrepresented among the working poor (56% vs. 36% of all working adults).6
Percentage of Labor Force That is Unemployed, Over Time
Percentage of Labor Force That is Unemployed, by County
|
Stories & Solutions
Social Determinants of Health
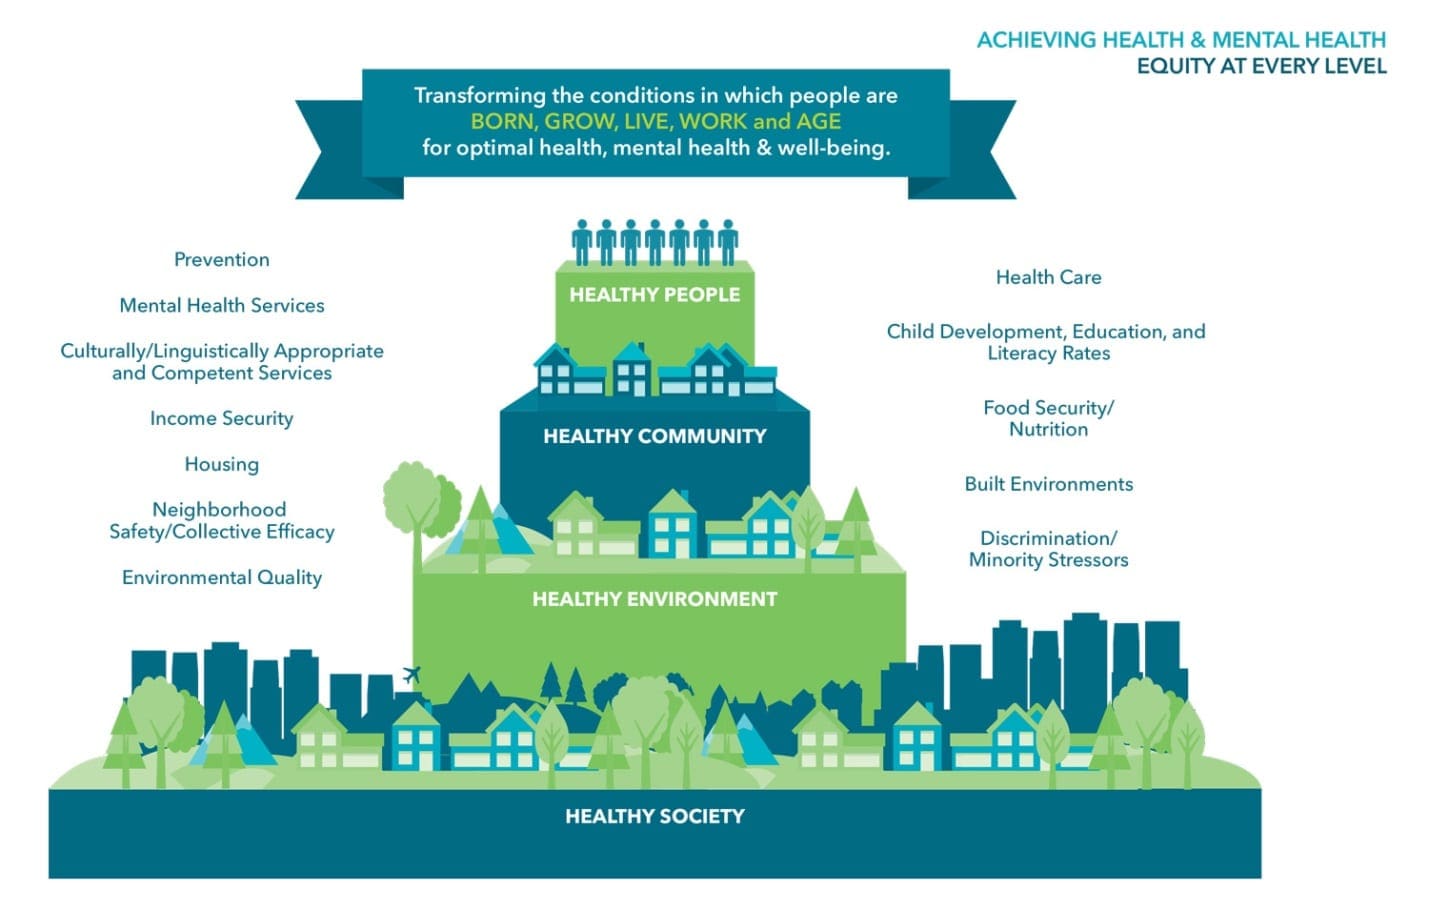
What Are Social Determinants of Health? The social determinants of health are the conditions in which we live, learn, work, and play.1 These conditions include a broad range of socioeconomic and environmental factors, such as air and water quality, the quality of the built environment (e.g., housing quality; land [...]

Food Security
How can we provide access to nutritious food for the 5.4 million Californians who experience food insecurity?

Early Childhood Well-being
How can we promote safe, stable, nurturing relationships and environments for healthy development?

Access to Services
How can we improve access to services that support health and enhance quality of life for Californians?

Community Cohesion and Violence Prevention
How can we create safe, connected, communities free of violence?

Access to Quality Care
How can all Californians achieve access to affordable, high-quality healthcare?

Clinical-Community Linkages
How can we build connections between health care systems, public health, and community partners?
Share Your Story
Want to engage in moving the dial on Creating Healthy Communities? Share your impact story!
More From Let’s Get Healthy California


