California’s infant mortality rate is one of the lowest in the nation.1
Infant mortality is an important indicator of the overall health of the population. The infant mortality rate is a highly sensitive measure of population health because there is an association between the causes of infant mortality and other factors that influence the health status of entire populations such as economic development, general living conditions, social well-being, rates of illness, quality and access to medical care, public health practices, and quality of the environment.
California has one of the lowest mortality infant rates in the nation. However, significant disparities persist, with respect to race and ethnicity, geography, and other socio-demographic characteristics. Reducing infant deaths is complex, requiring wide-ranging approaches and cross-sector collaborations.
This indicator tracks the number of deaths in infants under one year of age per 1,000 live births.
Infant Mortality
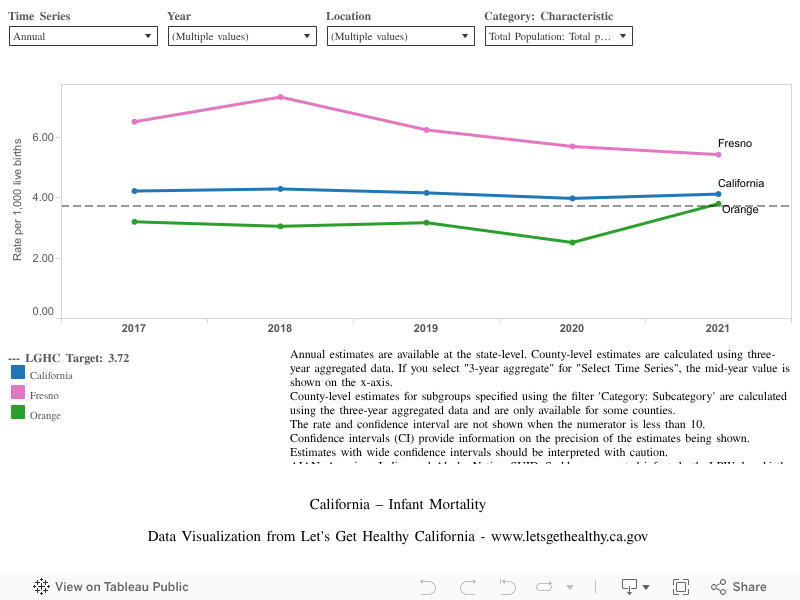
In 2021 (baseline year), there were 4.1 deaths in infants under one year of age per 1,000 live births. The most recent rate available is 4.1 (2021). We hope to reach a target of 3.72 or lower by 2034.
Baseline
4.1
Target
3.72
Indicator Highlights

California Home Visiting Program (CHVP)
Home visiting programs pair at-risk and expecting parents with public health nurses or para-professionals who offer an intensive, positive parenting program to help vulnerable families independently raise their children. Participants in the California Home Visiting Program have one or more risk factors including domestic violence, low income, unstable housing, less than 12 years of education, substance abuse, or depression and/or mental illness. CHVP focuses on improving maternal and newborn health; preventing childhood injuries, abuse, neglect, maltreatment, and Emergency Department visits; improving school readiness and achievements; reducing domestic violence; increasing family economic stability; and coordinating access to community resources, social services and supports. CHVP utilizes evidence-based home visiting models.
Causes and Risk Factors
Leading causes of infant death include birth defects, preterm birth, low birthweight, and sudden unexplained infant death.1
Low birthweight can cause serious problems in newborns and is a risk factor for infant deaths.
Impact of Stress
Chronic maternal stress is increasingly recognized as one of the contributing risk factors for preterm birth as well as chronic disease that develop later in life.2
Thousands of Babies Saved
Since awareness campaigns for safe sleep practices for babies started in 1994, the SIDS rate in California declined by 47% between 1992 and 1998. This decreased rate resulted in thousands of babies’ lives saved because parents and caregivers placed babies on their backs to sleep. 3
Promoting the health of women throughout life (both before and during pregnancy) is necessary to prevent preterm birth and low birth weight as well as other complications of pregnancy.4
Pregnant women and their newborns must have timely access to hospitals with the right level of quality health care to optimize health outcomes for mom and baby.5
Health for mothers and infants starts before the hospital or doctor’s office; it begins in communities. Healthy communities provide family support, safe places to live, smoke free environments, access to healthy foods and recreation, and prevention services such as immunizations and breastfeeding support.6
Healthy communities provide family support, safe places to live, smoke free environments, access to healthy foods and recreation, and prevention services such as immunizations and breastfeeding support.
Data Snapshot
Neighborhoods with a greater percent of the population experiencing poverty have higher rates of infant mortality compared to more well-off neighborhoods.
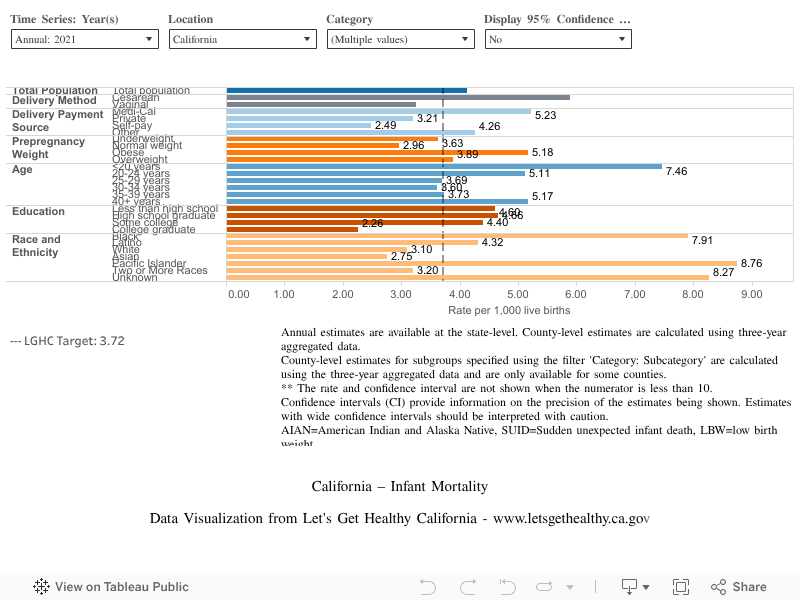
Although California’s infant mortality rate is lower than the national average, there are significant racial disparities, with Black or African American infants experiencing the highest mortality rate.
Infant Mortality Rate per 1,000 Live Births, Over Time
Infant Mortality Rate per 1,000 Live Births, by Demographic Category
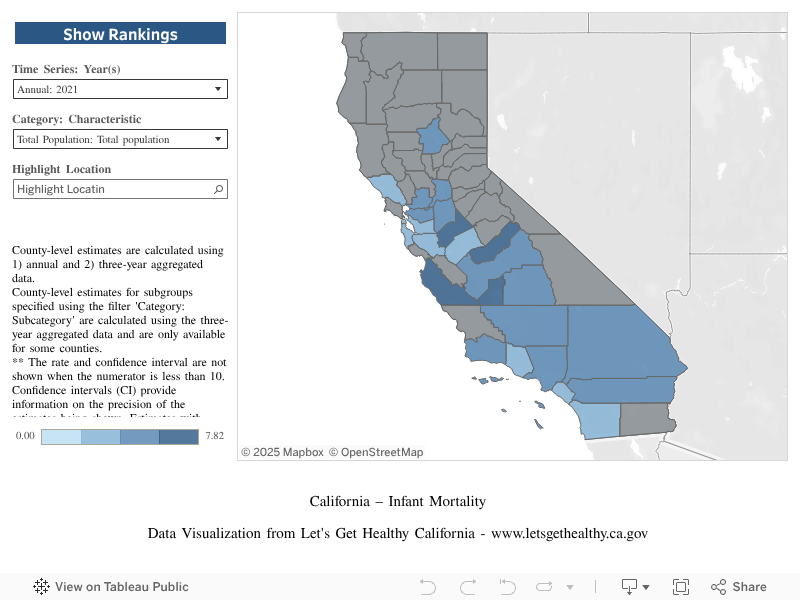
Infant Mortality Rate per 1,000 Live Births, by County
|
Stories & Solutions
Text4baby
The Text4baby app provides free text messages to help keep you and your baby healthy.

Best Babies Zone (BBZ) in Alameda County – Castlemont Neighborhood (Oakland, CA)
The Best Babies Zone (BBZ) Initiative is an innovative, multi-sector approach to reducing infant mortality and racial disparities in birth outcomes and improving birth and health outcomes by mobilizing communities to address the social determinants that affect health.

The California Newborn Screening Program
The California Newborn Screening (NBS) Program is the largest newborn screening program in the world, screening over 99% of babies every year in California for 80 different genetic and congenital disorders.
The California Prenatal Screening Program Story
The California Prenatal Screening Program helps to optimize pregnancy outcomes by offering accurate screening for birth defects and genetic conditions along with timely and effective follow-up services, including genetic counseling, for all pregnant women in California.

Getting the Right Level of Care
Ensuring mom and baby have access to hospitals with the right level of quality health care is an important and necessary health systems solution to reduce infant mortality.
California Home Visiting Program (CHVP)
Home visiting programs pair at-risk and expecting parents with public health nurses or para-professionals who offer an intensive, positive parenting program to help vulnerable families independently raise their children.
Share Your Story
Want to engage in moving the dial on Healthy Beginnings? Share your impact story!


