Californians need access to health care that reflects their diverse cultures and languages
For California’s diverse populations, ensuring that providers can engage with their patients in a culturally and linguistically competent way is essential to meaningful access.1 Culturally and Linguistically Appropriate Services (CLAS) are health care services that are provided to patients in a language that they understand, and with sensitivity to patients’ unique cultural and individual needs.2. Use of CLAS in healthcare settings is associated with care that is more efficient and less costly.3,4
There is currently no indicator to directly measure levels of access to CLAS. This has been identified as an opportunity for further data development to monitor this priority area of attention. In the meantime, the ability of patients to understand what their health care provider says is a way to measure one downstream dimension of CLAS: access to linguistically appropriate services. This indicator tracks the percent of adults who had difficulty understanding their medical provider among those who both speak a language other than English in the home and report not speaking English well.
Culturally and Linguistically Appropriate Services
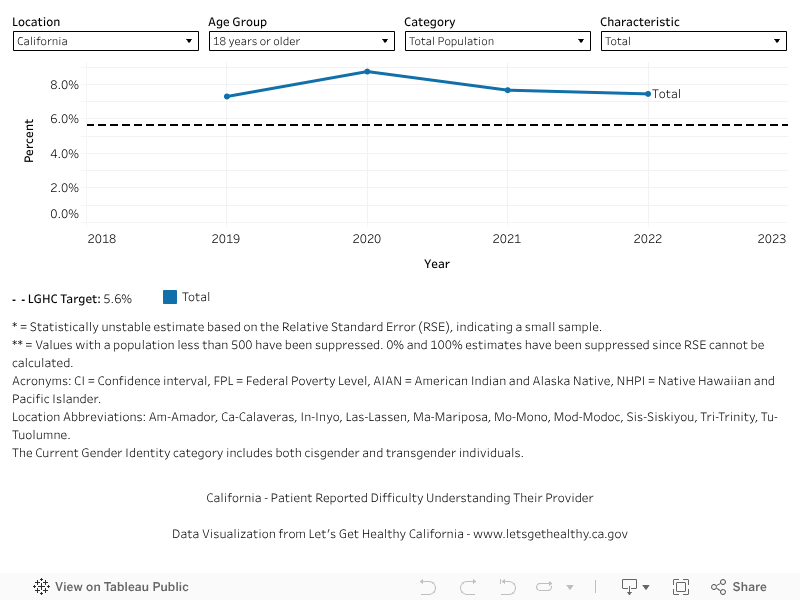
In 2022 (baseline year), 7.4% of adults who speak a language other than English in the home and do not speak English very well reported difficulty understanding their doctor at their last visit. The most recent data available show 7.4% (2022). We hope to reach a target of 5.6% or lower by 2034.
More Data about Culturally and Linguistically Appropriate Services
Baseline
7.5%
Target
5.6%
Indicator Highlights
A lack of cultural humility toward patients may lead to delayed care, lack of follow-up, or lower treatment adherence.5
In 2022, more than 1 in 12 California households had limited English proficiency (LEP).6
Patients who experience language barriers in health care settings receive care that is more expensive and less efficient.5
Community navigator programs can reduce cultural barriers to care and improve health outcomes.7
Data Snapshot
Cultural barriers to care, such as social stigma around health seeking behavior, can contribute to worse health outcomes in rural areas.9
Older patients are more likely to have limited English proficiency (LEP) than younger patients.5
Lack of access to culturally and linguistically appropriate care may contribute to racial and ethnic disparities in health outcomes.8
Percent of Adults Who Don’t Speak English Very Well and Had a Difficult Time Understanding Their Doctor During the Last Visit, Over Time
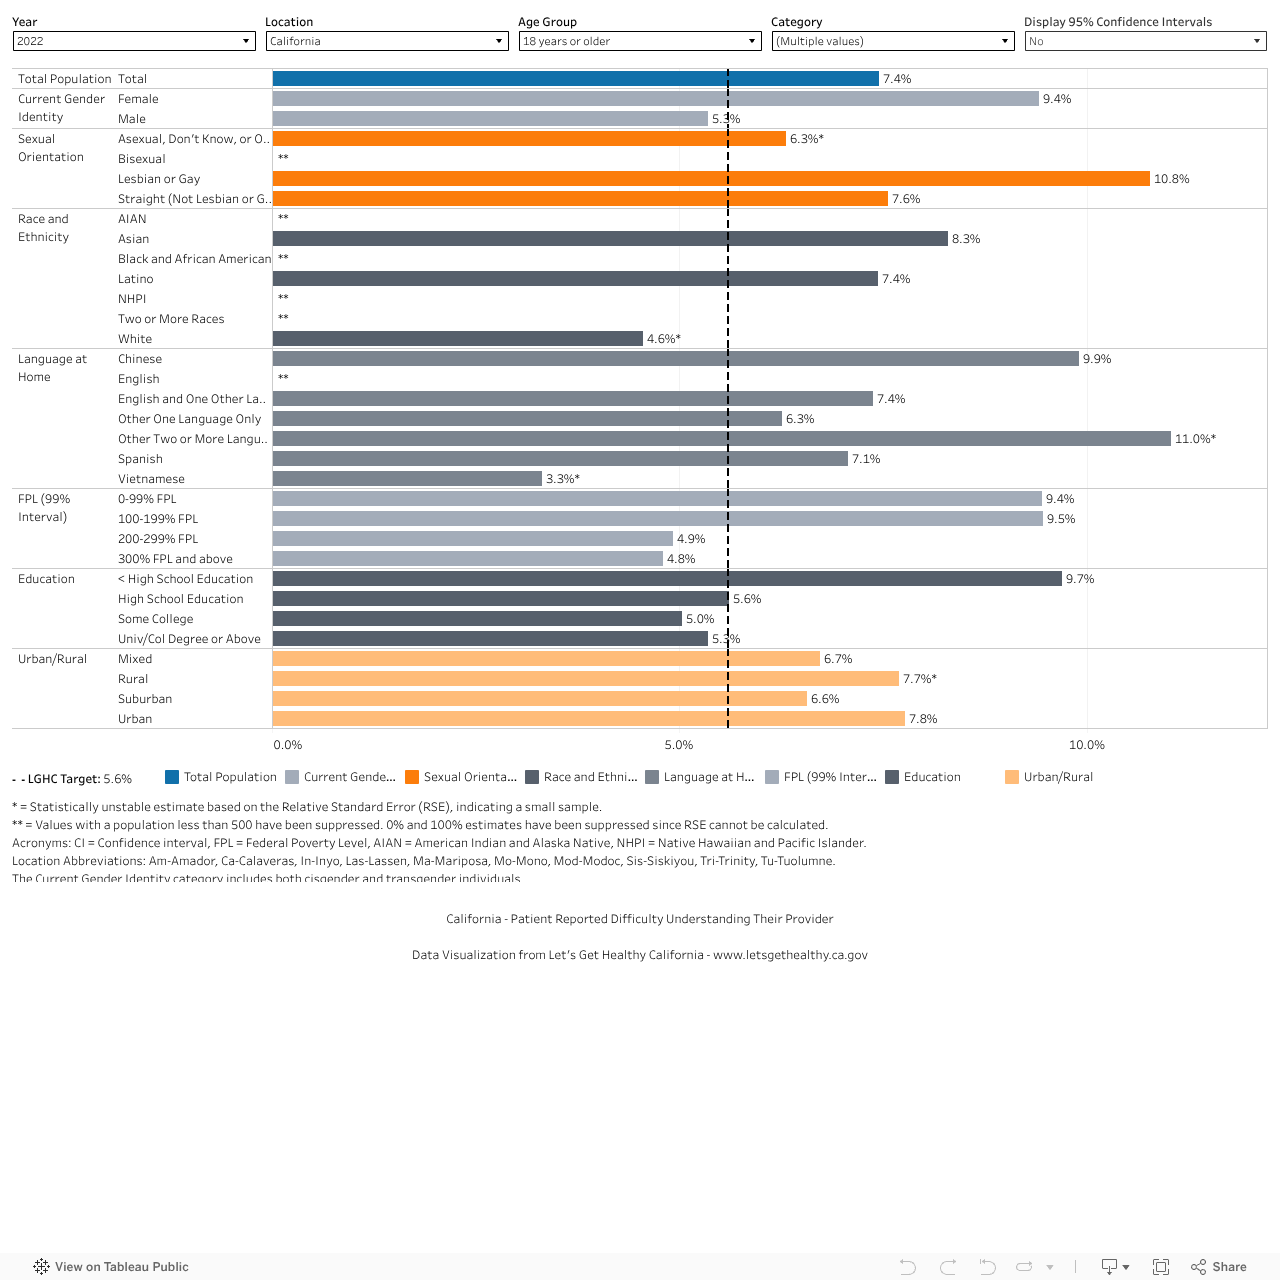
Percent of Adults Who Don’t Speak English Very Well and Had a Difficult Time Understanding Their Doctor During the Last Visit, by Demographic Category
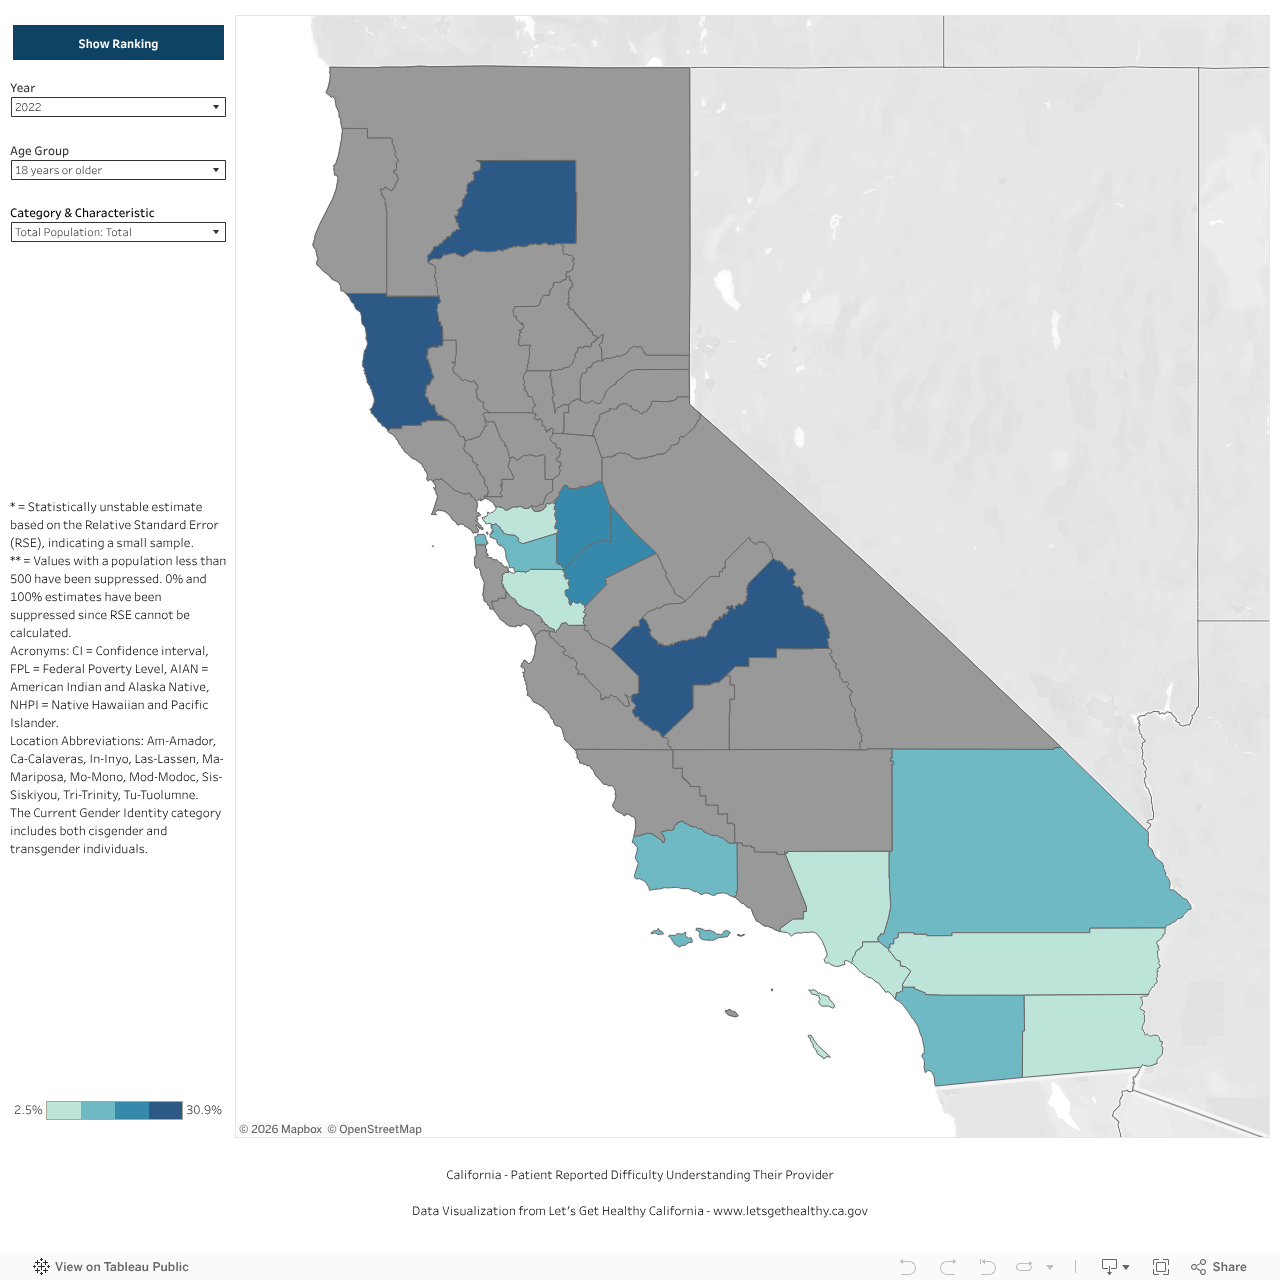
Percent of Adults Who Don’t Speak English Very Well and Had a Difficult Time Understanding Their Doctor During the Last Visit, by County
|
Share Your Story
Want to engage in moving the dial on the Redesigning the Health System goal? Share your impact story!


