Access to healthy, safe, affordable food is important for a nutritious diet and good health1
Access to affordable healthy food promotes healthy eating patterns and is crucial to reducing food insecurity, reducing hunger, and improving health.1,2 People experiencing food insecurity have limited, uncertain, or inconsistent access to adequate food that supports good health. Further, low-income households, communities of color, immigrants, people living in rural areas, and people living with disabilities experience food insecurity at disproportionate rates. Consumption of healthy foods — like fruits, vegetables, and whole grains —reduces risk for chronic diseases and can improve health; while consuming unhealthy foods — like foods high in saturated fat and added sugars —increase the risk for obesity, heart disease, type 2 diabetes, and other health problems. In lower income neighborhoods there are fewer large chain supermarkets and grocery stores with affordable fresh fruits and vegetables, but convenience stores and small markets with overpriced fruits and vegetables are prevalent. People with low incomes living in food deserts — areas with few options for securing affordable and healthy foods— are often reliant on foods that are convenient to access but low in nutrients, which increases the likelihood of experience chronic health conditions.3,4
Progress in increasing food access and affordability is being tracked using two indicators. The first indicator tracks the percent of adults with a low income (under 200 percent of the federal poverty level (FPL)) who reported that they were not able to afford enough food. The second indicator tracks the percent of healthier food retailers available in California, as defined by the modified retail food environment index (mRFEI).
Food Insecurity
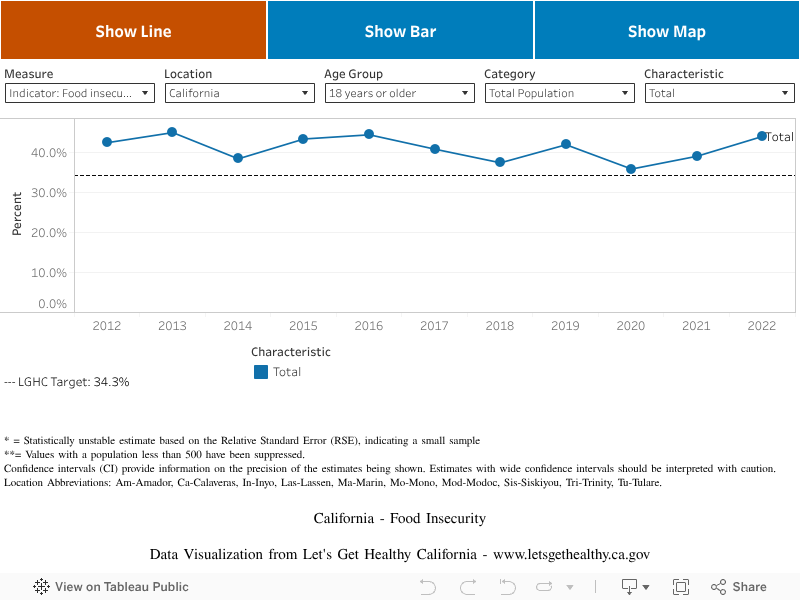
In 2022 (baseline year), 44% of lower income (< 200% FPL) California adults 18 years or older reported they were not able to afford enough food. The most recent data available (2022) show 44.0% of lower income adults were not able to afford enough food. We hope to reach a target of 34.3.% or lower by 2034.
Baseline
44.0%
Target
34.3%
Access to Healthy Food
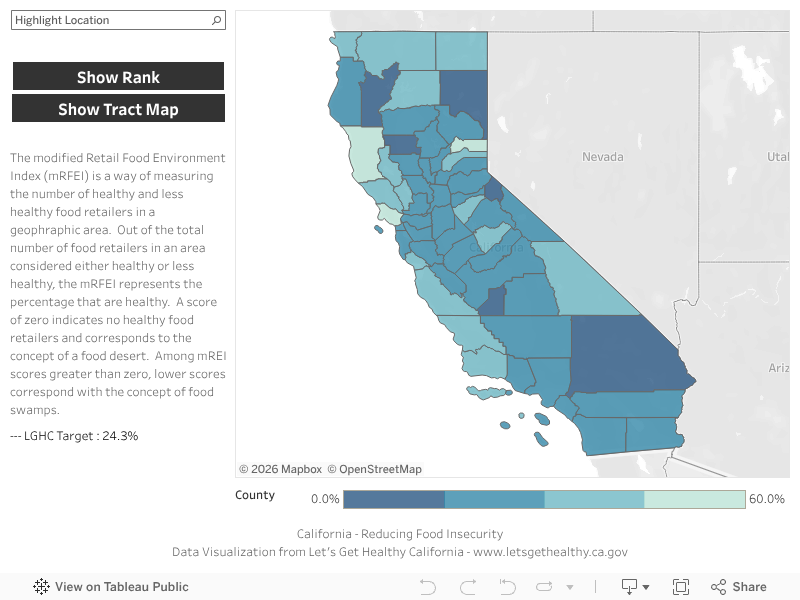
In 2022 (baseline year), the percent of healthier food retailers available in California, as defined by the modified retail food environment index (mRFEI), was 20.8%. The most recent data available showed a score of 20.8% (2022). We hope to reach a target of mRFEI score of 24.3% or greater by 2034.
Baseline
20.8%
Target
24.3%
Indicator Highlights

Skid Row Marketplace
The Skid Row Marketplace is part of a food and wellness collaborative that brings Skid Row residents and food justice allies together to improve the community’s food system with nutrition education, anti-hunger policy, and community gardening initiatives. It is facilitated by the Los Angeles Community Action Network (LA CAN) that serves the Skid Row and other under-served communities across Downtown and South Los Angeles. LA CAN takes a holistic approach to health problems that afflict residents experiencing homelessness and low-income residents of Skid Row due to a lack of sufficient access to health care, nutritious food, and quality, safe housing conditions. Skid Row has the largest concentration of low-income housing in the country and also has the largest concentration of unhoused residents living in street encampments in the country. 5 Read more »
No Markets and Higher Prices Impact Diets
One study found that residents with no supermarkets near their homes were 25-46% less likely to have a healthy diet, and a more recent study found that large differences in price between healthy and unhealthy food play a role in the ability to maintain a healthy diet.6,7
Unhealthy Ads Persist During Children’s Television Programming
Food ads on television make up 50 percent of all the ad time on children’s shows. The percent of ads for unhealthy food decreased from 2013 to 2022 following changes in the voluntary industry self-regulatory Children’s Food and Beverage Advertising Initiative (CFBAI). However, the majority (51%-52%) of CFBAI-member food and beverage advertisements on children’s programming continued to advertise unhealthy foods, with African American or Black children being exposed to more food-related television advertisements than White children. 8,9
Two in Five Can Not Afford Enough Food
More than two in five adults in California report they cannot afford enough food. While nearly four in five adults report fresh fruit and vegetables are always available in their neighborhoods, of those reporting both availability and regularly consumption of fresh fruit and vegetables, about 1 in 5 reports that they are only sometimes (17.0 percent), or never (1.4 percent) affordable. 10, 11, 12
Retail environments plays a critical role in our health. They not only impact the physical health of the people who visit them, but also the economic well-being of neighborhoods. Efforts to make healthy affordable food more accessible in lower income neighborhoods with less healthy retail environments can help prevent chronic disease in these communities. 11
Data Snapshot
Socioeconomic disparities in food access are persistent both nationally and statewide. In California, a study found fresh produce is more expensive in low-income neighborhoods and that convenience stores offer lower-quality produce, at more expensive prices, than other stores.13,14
In California, 44% of low-income adults (earning less than 200% of the federal poverty level) experienced food insecurity in 2022, up from 35.8% in 2020
Disparities in food security between racial and ethnic groups, as well as people living rural and urban areas, persisted in California.
In 2022, adults in California who identified as Two or More Races and Black or African American had the highest rates of food insecurity; compared with Whites and Asians who had the lowest rates.15,16
In 2022, more adults in California living in rural areas experienced food insecurity compared with those living in suburban and urban areas.
After several years of decreasing in California, food insecurity increased in 2022 due the ongoing impact of the COVID-19 pandemic on communities and families.15
In California, the percentage of adults experiencing food insecurity decreased overall from 43.3% in 2015 to 35.8% in 2020, then increased starkly to 44.0% in 2022.
Access to healthy food environments in California increased overall from 17.1% in 2017* to 20.8% in 2022.* – Note – the data source for food retail outlets changed between 2017 and 2022.
Percent of Adults Reporting Food Insecurity
Percent of Healthier Food Retailers Available in California, by County
|
Stories & Solutions
Skid Row Healthy Food Micro-Enterprise Project
Skid Row Healthy Food Micro-Enterprise Project by the Los Angeles Community Action Network is a pilot project in the early stages of development that seeks to serve the Skid Row community of Downtown Los Angeles.
Ending Hunger in Orange County (OC)
Orange County experiences a unique disparity in which it ranks sixth in highest median income statewide, while also ranking ninth nationwide in counties with the highest number of people facing food insecurity.
Market Makeovers Increase Access to Fresh Produce
Connecting a corner store, a farmers market, and a refrigerator to increase access to fresh produce for the L.A.’s Historic Filipinotown community. Historic Filipinotown is a community in the City of Los Angeles where the availability of and access to fresh produce is limited; 17 out of 25 small stores [...]
Share Your Story
Want to engage in moving the dial on Creating Healthy Communities? Share your impact story!
More From Let’s Get Healthy California


Get Involved
- CalFresh – California’s Supplemental Nutrition Assistance Program
- Women, Infants & Children Program (ca.gov)
- Nutrition and Physical Activity Branch – Program Focus Areas (ca.gov)
- California Universal Meals – School Nutrition (CA Dept of Education)
- CDFA Office of Farm to Fork – California Nutrition Incentive Program
- Hunger, Nutrition, and Health (ca.gov)

Get Data
- Access CHIS Data | California Health Interview Survey (CHIS) (ucla.edu)
- Nutrition and Physical Activity Branch – Research and Evaluation Section (RES) (ca.gov)
- Food Access Research Atlas | Economic Research Service
- Hunger & Poverty in the United States | Map the Meal Gap
- 2022 U.S. Business Locations and Business Summary data (arcgis.com)
- Data Axle—Esri Demographics Reference | Documentation (arcgis.com)
- 2017-2021 ACS 5-year Estimates (census.gov)