Obesity is linked to conditions that reduce quality and length of life1.
Overweight and obese children are at greater risk for obesity into adulthood and health challenges such as cardiovascular conditions, type 2 diabetes, and respiratory conditions. They also may experience psychological challenges such as anxiety, depression, and low self-esteem, as well as social problems such as bullying and stigma1. Obesity in adulthood is associated with serious chronic diseases that can reduce both quality of life and the lifespan. Risk factors for obesity include environmental factors, such as access to healthy affordable food and places for physical activity; health behaviors such as unhealthy eating patterns including processed foods and added sugars, lack of physical activity, poor sleep hygiene and excessive screen time; as well as genetic factors, some medical conditions and medications, and excessive stress2, 3.
These indicators track the percent of children who are overweight for their age, and percent of adults who are obese, in California.
Obesity – Children Overweight for Age
In 2022 (baseline year), 14.9% of children ages 0 to 11 years were overweight for their age. The most recent data available show 14.9% (2022). We hope to reach a target of 11.5% or lower by 2034.
Baseline
14.9%
Target
11.5%
Obesity – Adults
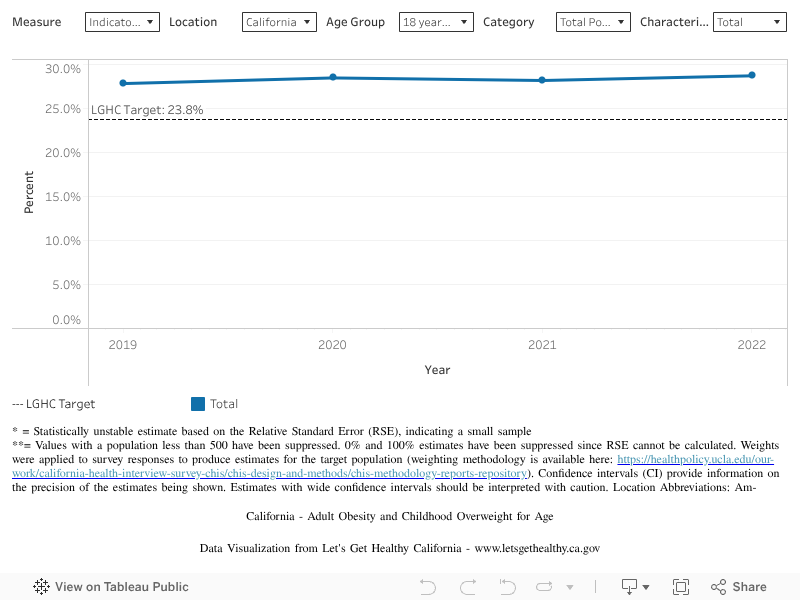
In 2022 (baseline year), 28.8% of adults were obese. The most recent data available show 28.8% (2022). We hope to reach a target of 24.4% or lower by 2034.
Baseline
28.8%
Target
24.4%
Indicator Highlights
Medical costs are $238 greater annually per overweight and obese child than per child with a healthy weight, with total increased medical costs of roughly $5 Billion per year, and more than 1% of total healthcare spending nationally4. California has the highest total obesity-related medical costs in the United States, with annual medical care expenditures of adults with obesity ($5,812) nearly three times greater than for adults with normal weight ($1,502), which is a greater difference than for any other state5.
Recent data demonstrated that roughly 1 in 6 youth ages 10 to 17 are obese both nationwide and in California6. For adults, about 2 in 5 are obese nationwide, which is slightly higher than for California7, 8.
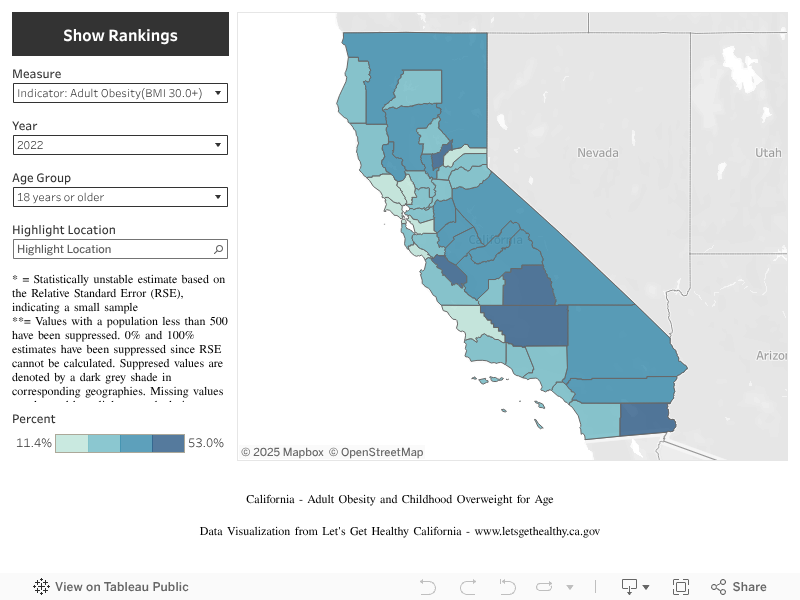
More than 1 in 4 adults in California are obese, increasing from 19.3% in 2001 to 28.2% in 20219. Further, by 2021, 30 of California’s 58 counties had adult obesity rates at or above the national Healthy People 2030 goal for adults (age 20 or older) of 30.5%, compared to none of the counties in 201110.
More than half of added sugars consumed by Americans are from sugar-sweetened beverages, desserts and sweet snacks. In addition, meals from fast food tend to be calorie dense with heavily processed ingredients containing high amounts of fat, added salt and sodium, and sugars, and are less nutritious than meals cooked at home. There is good evidence that limiting consumption of sugar-sweetened beverages and fast food reduces the risk of weight gain, obesity, and related health problems11, 12, 13.
Only 3 in 10 adults achieve the guidelines for physical activity14. Food deserts in socioeconomically disadvantaged communities, lack of healthy food choices in schools, and neighborhoods without nearby access to safe places for physical recreation such as parks, are all factors that contribute to health disparities in overweight and obesity9.
Research demonstrates food-insecure adults have higher rates of obesity and related health problems, and more than 2 in 5 adults with lower incomes in California (earning less than 200% of the federal poverty level) were not able to afford enough food in 202215.
Data Snapshot
California households with lower income levels had higher rates of children overweight for age than for households with higher income levels.
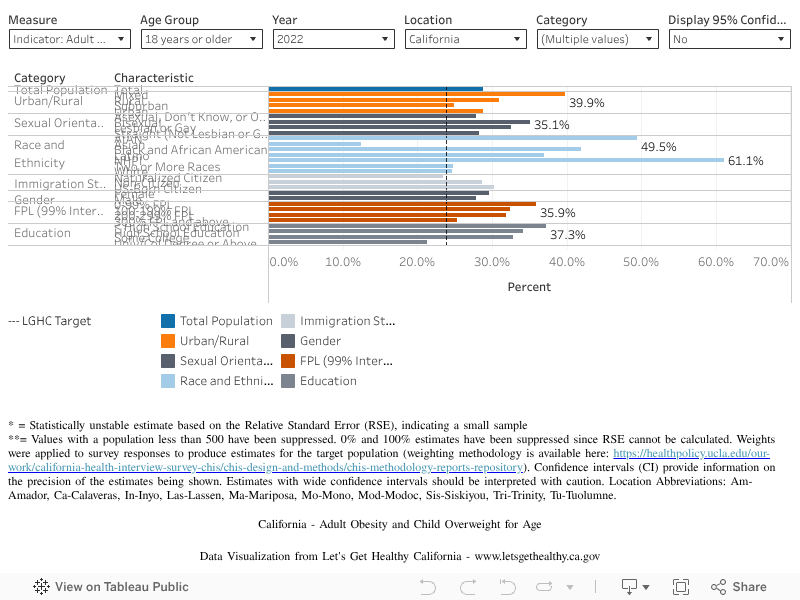
For adults in California, the lowest income and education levels had the highest levels of obesity.
The percent of children overweight for age in California from 2019 to 2022 was greater for Hispanics or Latinos and Blacks or African Americans than for the state overall. In contrast, the percent for Two or More Races, Whites, and Asians was lower than for the state overall for this period. These patterns in the percent of children overweight for age have been consistent in historical data.
For California adults, from 2019 to 2022 those identifying as Native Hawaiian and Pacific Islander, American Indian or Alaska Native, Black or African American, and Hispanic or Latino had greater rates of obesity than the overall statewide rate. In contrast, adults identifying as Two or More Races, White, and Asian had rates below the statewide rate during this period. These patterns in adult obesity rates have also been consistent in historical data.
Rates of childhood obesity have been increasing since the 1970s. However, during the pandemic, rates of childhood obesity were exacerbated16, 17, 18.
In California, 14.9% of children 0 to 11 years were overweight for age in 2022, figures that have remained relatively stable since 2019.
Rates of adult obesity have also been increasing for several decades, with just over one in four California adults being obese in 2022, and with rates being stable between 2019 to 2022.
Percent of Children Overweight for Age and Adults who are Obese, Over Time
Percent of Children Overweight for Age and Adults who are Obese, by Demographic Category
Percent of Children Overweight for Age and Adults who are Obese, by County
|
Stories & Solutions
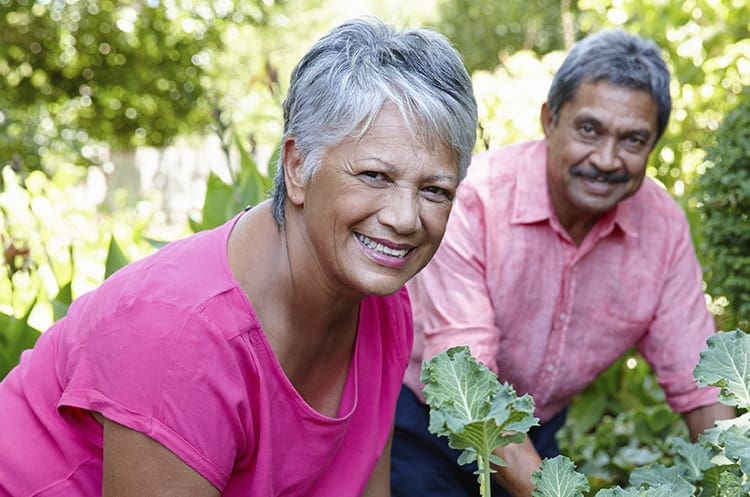
Growing Healthy Habits – A Community Garden Model
Yolo County Health and Human Services Agency has established a community garden at the agency’s Bauer building.

Market Makeovers Increase Access to Fresh Produce
Connecting a corner store, a farmers market, and a refrigerator to increase access to fresh produce for the L.A.’s Historic Filipinotown community. Historic Filipinotown is a community in the City of Los Angeles where the availability of and access to fresh produce is limited; 17 out of 25 small stores [...]

Rethink Your Drink
This public health initiative aims to educate low-income Californians about healthy drink options, help identify drinks with added sugar, and make the link between consumption of sugar-sweetened drinks and health risks.

Transportation and Community Plans that Promote Walking and Healthy Eating
Collaboration between residents, city council and city planners improves walkability between a corner store and elementary school.

Safe Routes to Healthy Places – San Diego County
The Healthier Me Initiative and creating policy, systems, and environmental change,
County Success Stories
Find out about other local efforts across the state with twenty-four noteworthy examples and success stories from eight different counties.
Share Your Story
Want to engage in moving the dial on the Living Well goal? Share your impact story!
More From Let’s Get Healthy California


Get Data
- Ask CHIS | California Health Interview Survey Dashboard
- California Community Obesity Profiles
- Welcome – California Health and Human Services Open Data Portal
- National Health and Nutrition Examination Survey | National Health and Nutrition Examination Survey | CDC
- National Survey of Children’s Health Questionnaires, Datasets, and Supporting Documents | MCHB (hrsa.gov)