California has the highest number of new cases of diabetes in the nation1
Diabetes is a chronic condition characterized by high levels of blood sugar resulting from issues with the body’s insulin production, insulin action, or both. Among US states, California has the highest number of new cases of diabetes.1
Indicator Progress
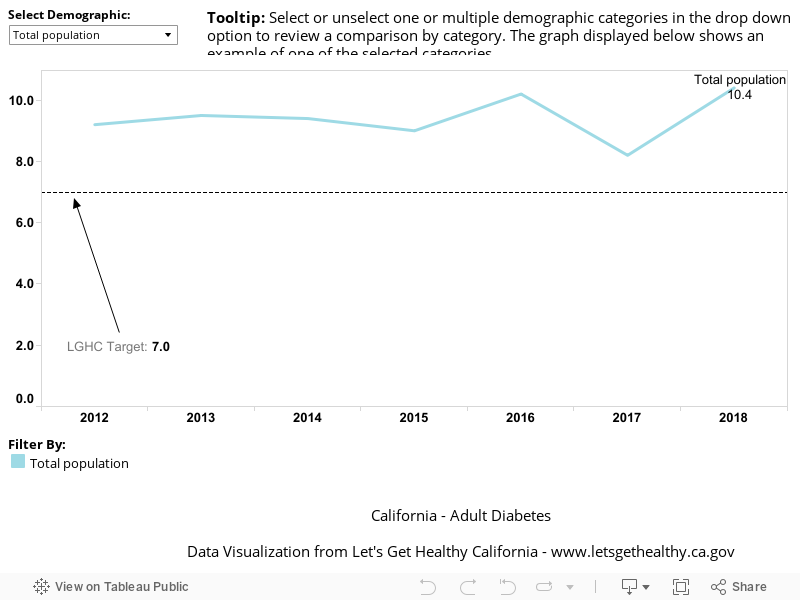
In 2012 (baseline year), the number of adults with diabetes per 100 was 9.2. The current value in 2018 was 10.4. The updated 2034 target is to be determined (TBD).
Diabetes Prevalence
Note: The baseline has changed from the original LGHC 2012 Task Force Report due to changes in survey methodology of the data source in 2012.
Baseline
9.2
Target
TBD
Indicator Highlights
The number of people with diabetes has increased by 32% over the past ten years.3
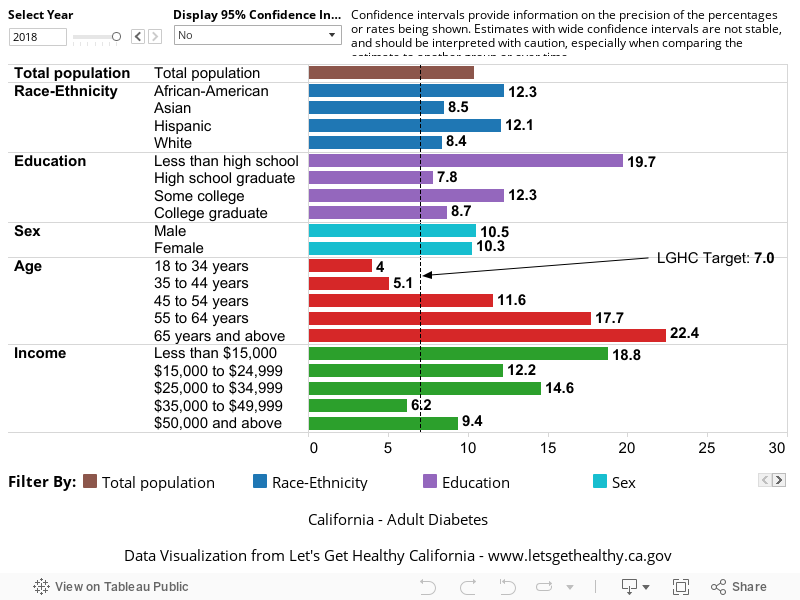
Research shows there is a close link between diabetes and low social or economic status. In California, ethnic minorities, the elderly, males, and individuals who are poor have higher rates of diabetes.2,3
Number of Adults with Diagnosed Diabetes per 100, Over Time
Number of Adults with Diagnosed Diabetes per 100, by Demographic Category
|
Stories & Solutions
County Success Stories
Find out about other local efforts across the state with twenty-four noteworthy examples and success stories from eight different counties.

Champion Mom Stories
Real families share tips from their experience taking steps toward a healthier more active lifestyle.

Tulare County
Impacting a rural community in Tulare County, a certified Electronic Benefit Transfer (EBT) accessible Farmer’s Market is established in Dinuba, CA.
Share Your Story
Want to engage in moving the dial on the Living Well goal? Share your impact story!


