California has the highest number of new cases of diabetes in the nation1
Diabetes is a chronic condition characterized by high levels of blood sugar resulting from issues with the body’s insulin production, insulin action, or both. Among US states, California has the highest number of new cases of diabetes.1
Indicator Progress
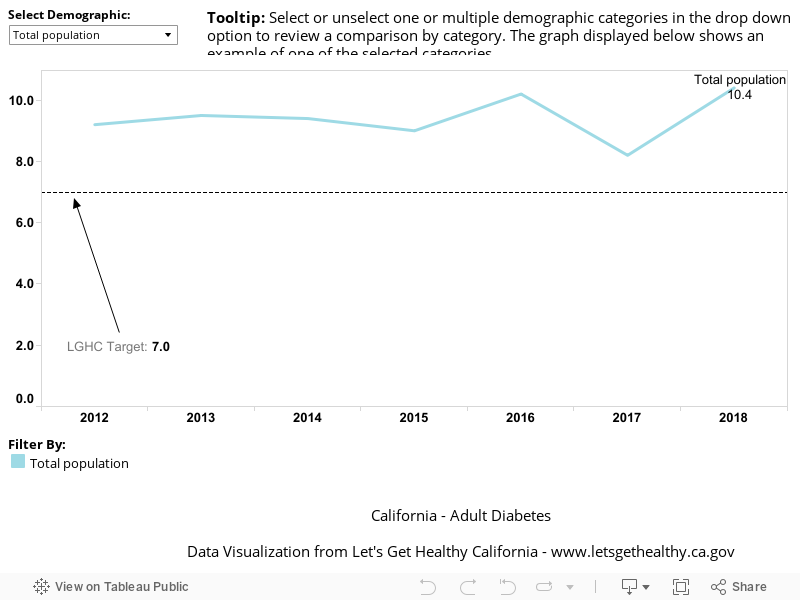
The 2012 baseline for the number of adults with diabetes per 100 is 9.2. In 2018, we were at 10.4 and hope to reach 7.0 or lower by 2022
More Data about Diabetes Prevalence
Diabetes Prevalence
Note: The baseline has changed from the original LGHC 2012 Task Force Report due to changes in survey methodology of the data source in 2012.
Baseline
9.2
Target
7.0
Indicator Highlights
The number of people with diabetes has increased by 32% over the past ten years.3
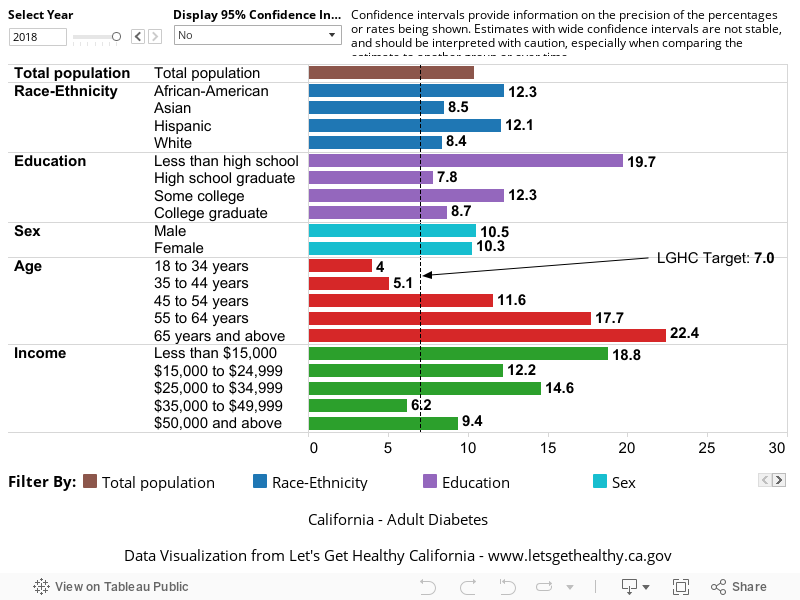
Research shows there is a close link between diabetes and low social or economic status. In California, ethnic minorities, the elderly, males, and individuals who are poor have higher rates of diabetes.2,3
Number of Adults with Diagnosed Diabetes per 100, Over Time
Number of Adults with Diagnosed Diabetes per 100, by Demographic Category
|
Stories & Solutions
Yin & Yang Project (Mind, Body, &Spirit)
Community Vocational Services, LLC, improves the quality of life of the developmentally disabled by providing a fitness program that includes a free gym membership with activities overseen by a certified fitness trainer for routine work-outs along with nutrition classes.
Zero Emissions Squared
Zero Emissions Squared converted a diesel school bus serving a low-income area to solar-powered.

California Reducing Disparities Project – Phase 1
Focuses on developing strategies to transform the public mental health system and identifying community-based promising practices in each of the five targeted populations. Read more »
California Reducing Disparities Project – Phase 2
Focus on funding and evaluating the promising practices identified in Phase 1, as well as advancing the strategies outlined in this plan. There has not been a project of this scope before; one that recognizes and elevates community practices and identifies strategies for systems change. Throughout this process, California will [...]
California Reducing Disparities Project – Stakeholder Generated Reports
Stakeholder workgroups focusing on five populations developed individual Population Reports that included recommendations for reducing disparities and removing barriers to accessing programs and services, along with an inventory of community-defined evidence and promising practices that could support efforts to reduce disparities.

The Healthy Stores for a Healthy Community Campaign
Public health advocates specializing in tobacco control, nutrition and alcohol prevention are working together to improve the health of Californians through changes in community stores and to educate people on how in-store marketing influences consumption of unhealthy products.

Market Makeovers Increase Access to Fresh Produce
Connecting a corner store, a farmers market, and a refrigerator to increase access to fresh produce for the L.A.’s Historic Filipinotown community. Historic Filipinotown is a community in the City of Los Angeles where the availability of and access to fresh produce is limited; 17 out of 25 small stores [...]

Rethink Your Drink
This public health initiative aims to educate low-income Californians about healthy drink options, help identify drinks with added sugar, and make the link between consumption of sugar-sweetened drinks and health risks.
Transportation and Community Plans that Promote Walking and Healthy Eating
Collaboration between residents, city council and city planners improves walkability between a corner store and elementary school.
Share Your Story
Want to engage in moving the dial on the Living Well goal? Share your impact story!


