About half of adult Californians report very good, or excellent health status
As the “Golden State”, California prides itself as a place where people can enjoy a high quality of life, be healthy, and pursue their dreams. Self-reported overall health status is consistent with objective measures of health status.1 Poor self-reported overall health status is associated with future disability2 and death.3 Because perceptions of health status can change along with health trends, beliefs about what is healthy, and changes to an individual’s personal circumstances, differences in overall health status over time should be interpreted with caution.4
This indicator tracks the percent of adults who reported very good or excellent overall health status.
Overall Health Status
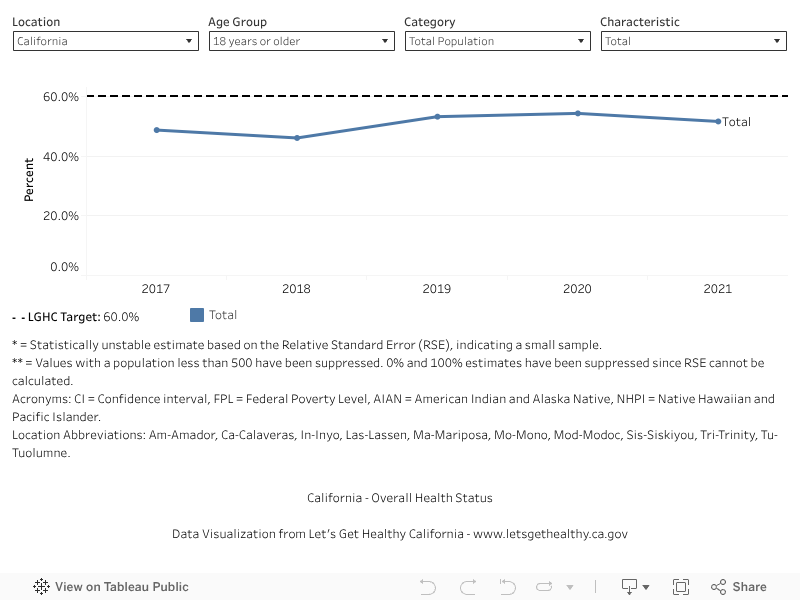
In 2021 (baseline year), 51.6% of adults who reported very good or excellent health. The most recent data available show 51.6% (2021). We hope to reach a target of 60.0% or higher by 2034.
Baseline
51.6%
Target
60.0%
Indicator Highlights
The life expectancy for Californians was 78.3 years in 2021.4
In 2022, the leading causes of death in California were ischemic heart disease, Alzheimer’s disease, stroke, and COVID-19.5
High-quality primary care can improve overall health status, and may reduce racial and ethnic disparities in overall health status.6
Data Snapshot
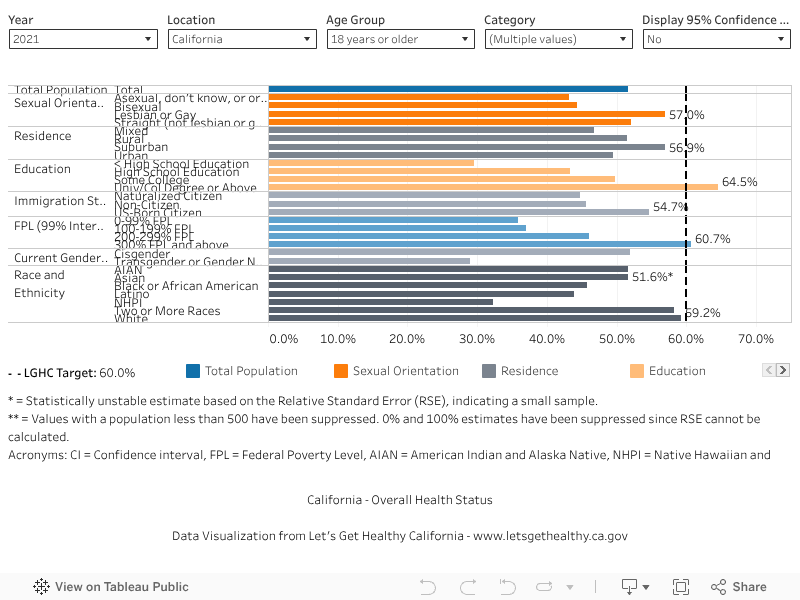
Less than 40% of Californians with income at or below 200% of the Federal Poverty Level (FPL) reported very good or excellent health overall in 2021.
Self-reported overall health is worse in rural counties than in urban counties.
In 2021, the percent of Californians reporting very good or excellent health overall was lower for Black, Asian, Latino, Native Hawaiian and Pacific Islander, and American Indian and Alaska Native Californians than for White and Multiracial Californians.
Percent of Respondents Who Report Overall Health Status to be Very Good, or Excellent, Over Time
Percent of Respondents Who Report Overall Health Status to be Very Good, or Excellent, by Demographic Category
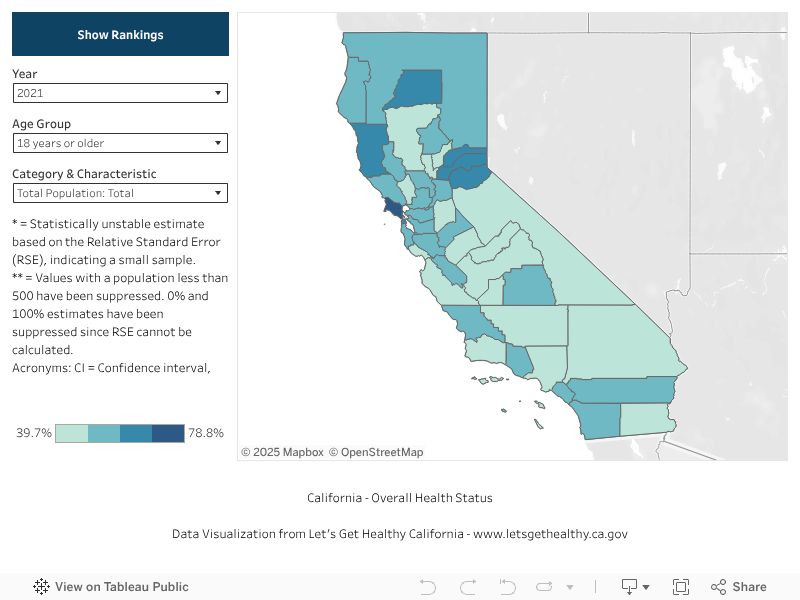
Percent of Respondents Who Report Overall Health Status to be Very Good, or Excellent, by County
|
Share Your Story
Want to engage in moving the dial on the Living Well goal? Share your impact story!
Stories & Solutions

AARP Livability Index
The AARP Livability Index is a web-based tool used to measure community livability.


