Creating Healthy Communities / Reducing Housing Cost Burden

Reducing Housing Cost Burden2025-07-09T09:29:14-07:00

Housing cost burden is linked to poor health outcomes, preventable deaths, and housing instability or homelessness1

Housing is considered affordable when the cost of housing makes up 30% or less of a household’s income.2 Housing cost burden happens when a household spends more than 30% of income on housing, which leaves less money left over to cover other necessities like food, transportation, and health care.

This indicator tracks the percent of households in California that experience housing cost burden.

Housing Cost Burden

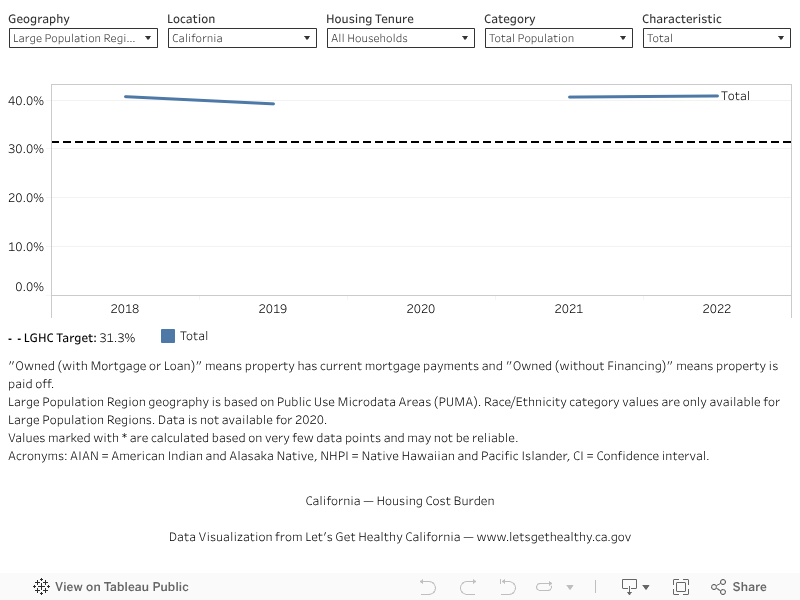
In 2022, 40.9% of households in California experienced housing cost burden. The most recent data available show 40.9% (2022). We hope to reach a target of 31.3% of California households or lower experiencing housing cost burden by 2034.

More Data about Housing Cost Burden

Baseline

40.9%

Current Rate

40.9%

Target

31.3%

Indicator Highlights
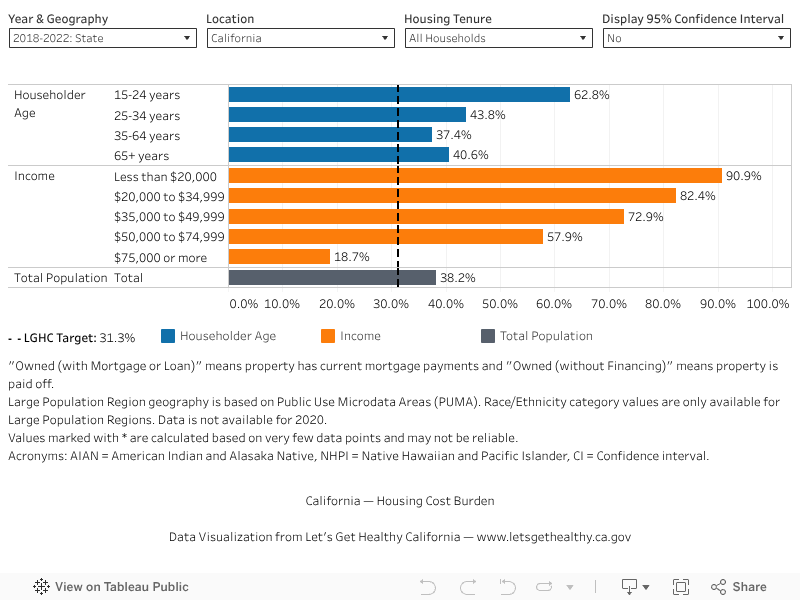
Data Snapshot

Percent of Californians with Housing Cost Burden, Over Time

Visualization Help

Percent of Californians with Housing Cost Burden, by Demographic Category

Visualization Help

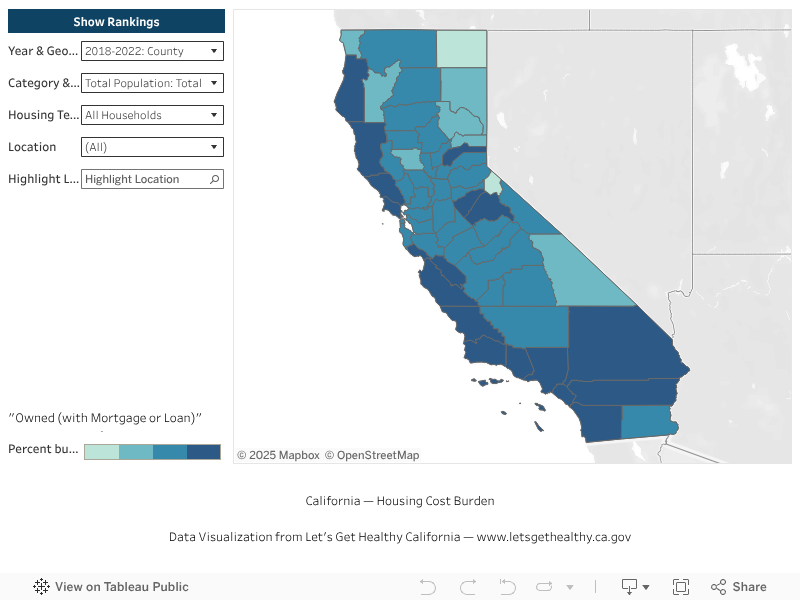
Percent of Californians with Housing Cost Burden, by Location

Visualization Help

|

IndicatorPercent of households experiencing housing cost burden (>30% of monthly income spent on housing), California.

Indicator Description: Indicators are from the American Community Survey (ACS) administered annually by the United States Census Bureau. Survey respondents were asked to indicate the annual income from all sources (wages, interest, retirement, social security, etc.) of all household members, as well as the monthly cost for rent or mortgage (as applicable), property tax, fuel, and other monthly costs.

Data Limitations: Disaggregation by mutually exclusive race and ethnicity, as well as income categories, are not available for all geographies. Does not include those living in group quarters or homeless persons. The dashboard draws on data from ACS detailed tables for the county and census tract geographies, and the Public Use Microdata Sample (PUMS) for the large population region geography. PUMS 5-year estimates are not available through the tidycensus package in R for 2018-2022 due to changes in microdata area definitions across years; data for 1-year estimates (both PUMS and ACS detailed tables) are not available for 2020 due to the impact of the COVID-19 pandemic on the survey (see: https://www.census.gov/newsroom/press-releases/2021/changes-2020-acs-1-year.html).

Indicator Source: The United States Census Bureau’s ACS is an annual population-based survey of households in the United States that covers over 40 topics. It is the most current, reliable, and accessible data source for local statistics on population and housing characteristics in the country. ACS data is made publicly available by the Census Bureau.

Indicator Calculation Methodology: This indicator is computed by comparing monthly housing costs to income (converted from annual income/12). For additional details on how selected housing costs are defined, please see the ACS Subject definitions found on the Census ACS Code Lists, Definitions, and Accuracy webpage. Housing cost burden prevalence was calculated by dividing the estimate of the burdened population by the total population within the relevant universe. For example, burden for renters was calculated by summing the estimated number of renters who pay more than 30% of their income toward rent, divided by the estimate of the total renting population. The indicator was computed using detailed ACS tables and PUMS data. Unlike pre-tabulated data products provided by ACS, the PUMS enables users to create custom estimates and allows for more data stratification. The indicator was computed using PUMS variables TEN, RAC1P, HISP, ADJINC, HINCP, GRPIP, OCPIP and ACS detailed tables B19013, B25072, B25093, B25095, B25101, B25106, B25140.

Data Collection Methodology: National survey conducted by mail, online, and phone survey methods using a geographically stratified sample design. Estimates are weighted to conform to estimates from the Census Bureau Population Estimate Program.

Program URL Link: https://www.census.gov/programs-surveys/acs

Reporting Cycle: Annually (December)

1. Park, G-R., Grignon, M., Young, M. & Dunn, J. R. (2023). The association between housing cost burden and avoidable mortality in wealthy countries. Journal of Epidemiology & Community Health, 77(2), 65-73. https://jech.bmj.com/content/77/2/65

2. U. S. Department of Housing and Urban Development. (2011, August 18). Glossary of terms to affordable housing. U. S. Department of Housing and Urban Development Archives https://archives.hud.gov/local/nv/goodstories/2006-04-06glos.cfm

3. Martinez, M. & Mather, M. (2022, April 15). S. housing cost burden declines among homeowners but remains high for renters. Population Reference Bureau. https://www.prb.org/articles/u-s-housing-cost-burden-declines-among-homeowners-but-remains-high-for-renters/

4. Joint Center for Housing Studies of Harvard University. (2024) The State of the Nation’s Housing 2024. https://www.jchs.harvard.edu/sites/default/files/reports/files/Harvard_JCHS_The_State_of_the_Nations_Housing_2024.pdf

5. Shamsuddin, S. & Campbell, C. (2021). Housing cost burden, material hardship, and well-being. Housing Policy Debate, 32(3), 413-432. https://doi.org/10.1080/10511482.2021.1882532

6. PolicyLink; Center for Popular Democracy; Right To The City Alliance. (2019). Our Homes, Our Future: How Rent Control can Build Stable, Healthy Communities. https://www.policylink.org/sites/default/files/OurHomesOurFuture_Web_08-02-19.pdf

7. Jenkins Morales, M. & Robert, S. A. (2020). The effects of housing cost burden and housing tenure on moves to a nursing home among low- and moderate-income older adults. Gerontologist, 60(8), 1485-1494. https://pubmed.ncbi.nlm.nih.gov/32542373/

8. Jenkins Morales, M. & Robert, S. A. (2021). Housing cost burden and health decline among low- and moderate-income older renters. Gerontology: Series B, 77(4), 815-826. https://doi.org/10.1093/geronb/gbab184

9. Nobari, T. Z., Anderson, C. E., & Whaley, S. E. (2023). The COVID‑19 pandemic contributed to disparities in housing‑cost burden among WIC‑participating households in the most populous county in California. Journal of Racial and Ethnic Health Disparities, 10, 100-109. https://doi.org/10.1007/s40615-021-01200-7

10. Greenberg, M., Angelo, H., Losada, E., & Wilmers, C. C. (2024). Relational geographies of urban unsustainability: The entanglement of California’s housing crisis with WUI growth and climate change. PNAS, 121(32), e2310080121. https://doi.org/10.1073/pnas.2310080121

11. Grant, E., & Runkle, J. D. (2022). Long-term health effects of wildfire exposure: A scoping review. The Journal of Climate Change and Health, 6, 100110. https://doi.org/10.1016/j.joclim.2021.100110

Share Your Story

Want to engage in moving the dial on Creating Healthy Communities? Share your impact story!

Submit Your Story

Go to Top